Download
1 / 1
10 likes | 120 Views
Chromatin Immunoprecipitation (ChIP). Jurkat Leukemia cells. Prepare nuclei. Treat nuclei with different concentrations of MNase I to release representative fractions of chromatin. Input (Ref ). Purify di, & mononucleosomes on a sucrose gradient. Ac. Purify DNA. Ac. Ac. Me. Ac. Ac.

E N D
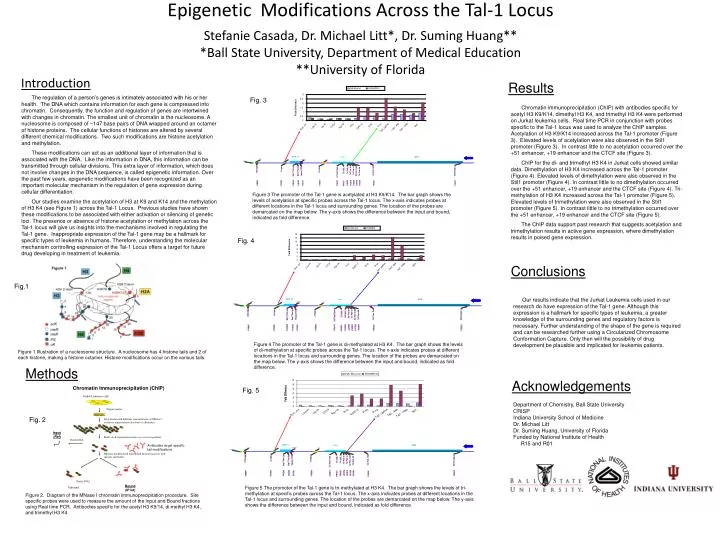
Chromatin Immunoprecipitation (ChIP) Jurkat Leukemia cells Prepare nuclei Treat nuclei with different concentrations of MNase I to release representative fractions of chromatin Input (Ref) Purify di, & mononucleosomes on a sucrose gradient Ac Purify DNA Ac Ac Me Ac Ac Ac Antibodies target specific tail modifications Ac Ac Me Me Separate modified and unmodified histones fraction with specific antibodies Ac Ac Ac Ac Purify DNA Bound (IP’ed) Unbound NA Bound H3AcK914 3 2.5 2 1.5 Fold Difference 1 0.5 0 Pr1b Pr1a Stil1 PrIV CTCF Up Pr Low Pr Rg+19 CpG1-2 Enh +51 Tal1 -4kb Tal1 -16kb Tal1 UpPrA NA Bound H32MK4 14 Fig. 4 12 10 8 Fold Difference 6 4 2 0 PrIV Stil1 Pr1b Pr1a CTCF Up Pr Low Pr Rg+19 CpG1-2 Enh +51 Tal1 -4kb Tal1 -16kb Tal1 UpPrA EpigeneticModifications Across the Tal-1 Locus Stefanie Casada, Dr. Michael Litt*, Dr. Suming Huang***Ball State University, Department of Medical Education**University of Florida Results The regulation of a person’s genes is intimately associated with his or her health. The DNA which contains information for each gene is compressed into chromatin. Consequently, the function and regulation of genes are intertwined with changes in chromatin. The smallest unit of chromatin is the nucleosome. A nucleosome is composed of ~147 base pairs of DNA wrapped around an octamer of histone proteins. The cellular functions of histones are altered by several different chemical modifications. Two such modifications are histone acetylation and methylation. These modifications can act as an additional layer of information that is associated with the DNA. Like the information in DNA, this information can be transmitted through cellular divisions. This extra layer of information, which does not involve changes in the DNA sequence, is called epigenetic information. Over the past few years, epigenetic modifications have been recognized as an important molecular mechanism in the regulation of gene expression during cellular differentiation. Our studies examine the acetylation of H3 at K9 and K14 and the methylation of H3 K4 (see Figure 1) across the Tal-1 Locus. Previous studies have shown these modifications to be associated with either activation or silencing of genetic loci. The presence or absence of histone acetylation or methylation across the Tal-1 locus will give us insights into the mechanisms involved in regulating the Tal-1 gene. Inappropriate expression of the Tal-1 gene may be a hallmark for specific types of leukemia in humans. Therefore, understanding the molecular mechanism controlling expression of the Tal-1 Locus offers a target for future drug developing in treatment of leukemia. Fig. 3 Chromatin immunoprecipitation (ChIP) with antibodies specific for acetyl H3 K9/K14, dimethyl H3 K4, and trimethyl H3 K4 were performed on Jurkat leukemia cells. Real time PCR in conjunction with probes specific to the Tal-1 locus was used to analyze the ChIP samples. Acetylation of H3 K9/K14 increased across the Tal-1 promoter (Figure 3). Elevated levels of acetylation were also observed in the Stil1 promoter (Figure 3). In contrast little to no acetylation occurred over the +51 enhancer, +19 enhancer and the CTCF site (Figure 3). ChIP for the di- and trimethyl H3 K4 in Jurkat cells showed similar data. Dimethylation of H3 K4 increased across the Tal-1 promoter (Figure 4). Elevated levels of dimethylation were also observed in the Stil1 promoter (Figure 4). In contrast little to no dimethylation occurred over the +51 enhancer, +19 enhancer and the CTCF site (Figure 4). Tri-methylation of H3 K4 increased across the Tal-1 promoter (Figure 5). Elevated levels of trimethylation were also observed in the Stil1 promoter (Figure 5). In contrast little to no trimethylation occurred over the +51 enhancer, +19 enhancer and the CTCF site (Figure 5). The ChIP data support past research that suggests acetylation and trimethylation results in active gene expression, where dimethylation results in poised gene expression. Figure 3 The promoter of the Tal-1 gene is acetylated at H3 K9/K14. The bar graph shows the levels of acetylation at specific probes across the Tal-1 locus. The x-axis indicates probes at different locations in the Tal-1 locus and surrounding genes. The location of the probes are demarcated on the map below. The y-axis shows the difference between the input and bound, indicated as fold difference. Conclusions Fig.1 Our results indicate that the Jurkat Leukemia cells used in our research do have expression of the Tal-1 gene. Although this expression is a hallmark for specific types of leukemia, a greater knowledge of the surrounding genes and regulatory factors is necessary. Further understanding of the shape of the gene is required and can be researched further using a Circularized Chromosome Conformation Capture. Only then will the possibility of drug development be plausible and implicated for leukemia patients. Figure 4 The promoter of the Tal-1 gene is di-methylated at H3 K4. The bar graph shows the levels of di-methylation at specific probes across the Tal-1 locus. The x-axis indicates probes at different locations in the Tal-1 locus and surrounding genes. The location of the probes are demarcated on the map below. The y-axis shows the difference between the input and bound, indicated as fold difference. Figure 1 Illustration of a nucleosome structure. A nucleosome has 4 histone tails and 2 of each histone, making a histone octamer. Histone modifications occur on the various tails. Methods Acknowledgements Fig. 5 • Department of Chemistry, Ball State University • CRISP • Indiana University School of Medicine • Dr. Michael Litt • Dr. Suming Huang, University of Florida • Funded by National Institute of Health • R15 and R01 Fig. 2 Figure 5 The promoter of the Tal-1 gene is tri-methylated at H3 K4. The bar graph shows the levels of tri-methylation at specific probes across the Tal-1 locus. The x-axis indicates probes at different locations in the Tal-1 locus and surrounding genes. The location of the probes are demarcated on the map below. The y-axis shows the difference between the input and bound, indicated as fold difference. Figure 2. Diagram of the MNase I chromatin immunoprecipitation procedure. Site specific probes were used to measure the amount of the Input and Bound fractions using Real time PCR. Antibodies specific for the acetyl H3 K9/14, di-methyl H3 K4, and trimethyl H3 K4 Introduction