Download
1 / 1
10 likes | 174 Views
Quantitative real-time PCR on native prostate cancer biopsies: establishment of the technology and first comparative results Susanne Unversucht , Axel Meye, Michael Haase # , Susanne Fuessel and Manfred P. Wirth

E N D
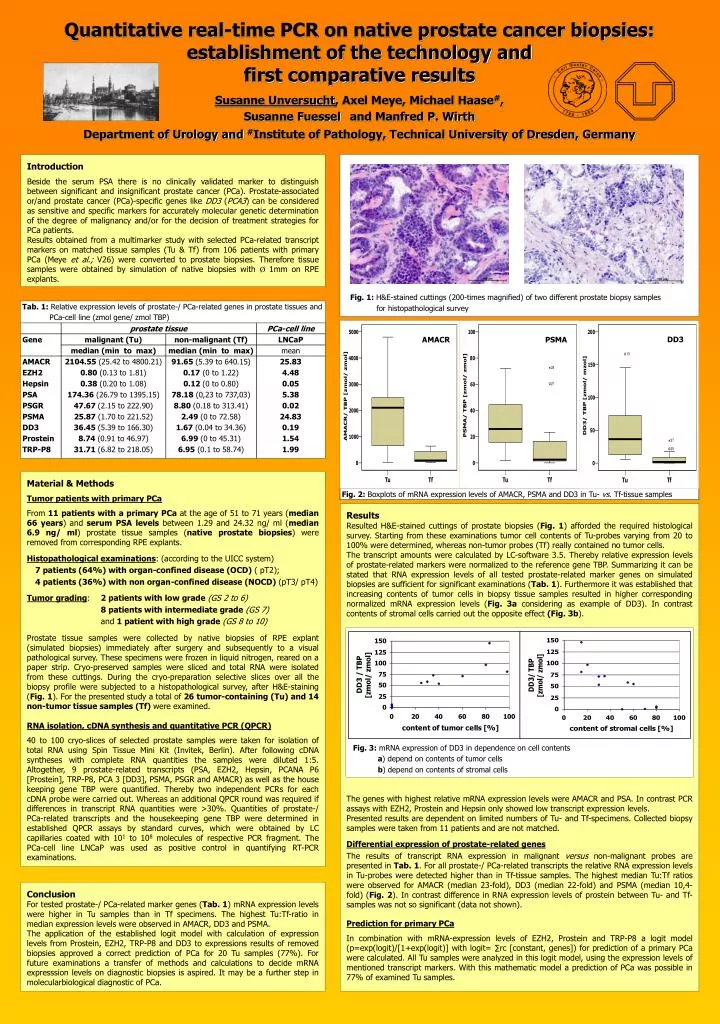
Quantitative real-time PCR on native prostate cancer biopsies: establishment of the technology and first comparative results Susanne Unversucht, Axel Meye, Michael Haase#, Susanne Fuessel and Manfred P. Wirth Department of Urology and #Institute of Pathology, Technical University of Dresden, Germany DD3 AMACR PSMA Fig. 2: Boxplots of mRNA expression levels of AMACR, PSMA and DD3 in Tu- vs. Tf-tissue samples Fig. 1: H&E-stained cuttings (200-times magnified) of two different prostate biopsy samples for histopathological survey Fig. 3: mRNA expression of DD3 in dependence on cell contents a) depend on contents of tumor cells b) depend on contents of stromal cells Introduction Beside the serum PSA there is no clinically validated marker to distinguish between significant and insignificant prostate cancer (PCa). Prostate-associated or/and prostate cancer (PCa)-specific genes like DD3 (PCA3) can be considered as sensitive and specific markers for accurately molecular genetic determination of the degree of malignancy and/or for the decision of treatment strategies for PCa patients. Results obtained from a multimarker study with selected PCa-related transcript markers on matched tissue samples (Tu & Tf) from 106 patients with primary PCa (Meye et al.; V26) were converted to prostate biopsies. Therefore tissue samples were obtained by simulation of native biopsies with Ø 1mm on RPE explants. Tab. 1: Relative expression levels of prostate-/ PCa-related genes in prostate tissues and PCa-cell line (zmol gene/ zmol TBP) Material & Methods Tumor patients with primary PCa From 11 patients with a primary PCa at the age of 51 to 71 years (median 66 years) and serum PSA levels between 1.29 and 24.32 ng/ ml (median 6.9 ng/ ml) prostate tissue samples (native prostate biopsies) were removed from corresponding RPE explants. Histopathological examinations: (according to the UICC system) 7 patients (64%) with organ-confined disease (OCD) ( pT2); 4 patients (36%)with non organ-confined disease (NOCD) (pT3/ pT4) Tumor grading: 2 patients with low grade (GS 2 to 6) 8 patients with intermediate grade (GS 7) and 1 patient with high grade (GS 8 to 10) Prostate tissue samples were collected by native biopsies of RPE explant (simulated biopsies) immediately after surgery and subsequently to a visual pathological survey. These specimens were frozen in liquid nitrogen, reared on a paper strip. Cryo-preserved samples were sliced and total RNA were isolated from these cuttings. During the cryo-preparation selective slices over all the biopsy profile were subjected to a histopathological survey, after H&E-staining (Fig. 1). For the presented study a total of 26 tumor-containing (Tu) and 14 non-tumor tissue samples (Tf) were examined. RNA isolation, cDNA synthesis and quantitative PCR (QPCR) 40 to 100 cryo-slices of selected prostate samples were taken for isolation of total RNA using Spin Tissue Mini Kit (Invitek, Berlin). After following cDNA syntheses with complete RNA quantities the samples were diluted 1:5. Altogether, 9 prostate-related transcripts (PSA, EZH2, Hepsin, PCANA P6 [Prostein], TRP-P8, PCA 3 [DD3], PSMA, PSGR and AMACR) as well as the house keeping gene TBP were quantified. Thereby two independent PCRs for each cDNA probe were carried out. Whereas an additional QPCR round was required if differences in transcript RNA quantities were >30%. Quantities of prostate-/ PCa-related transcripts and the housekeeping gene TBP were determined in established QPCR assays by standard curves, which were obtained by LC capillaries coated with 101 to 108 molecules of respective PCR fragment. The PCa-cell line LNCaP was used as positive control in quantifying RT-PCR examinations. Results Resulted H&E-stained cuttings of prostate biopsies (Fig. 1) afforded the required histological survey. Starting from these examinations tumor cell contents of Tu-probes varying from 20 to 100% were determined, whereas non-tumor probes (Tf) really contained no tumor cells. The transcript amounts were calculated by LC-software 3.5. Thereby relative expression levels of prostate-related markers were normalized to the reference gene TBP. Summarizing it can be stated that RNA expression levels of all tested prostate-related marker genes on simulated biopsies are sufficient for significant examinations (Tab. 1). Furthermore it was established that increasing contents of tumor cells in biopsy tissue samples resulted in higher corresponding normalized mRNA expression levels (Fig. 3a considering as example of DD3). In contrast contents of stromal cells carried out the opposite effect (Fig. 3b). The genes with highest relative mRNA expression levels were AMACR and PSA. In contrast PCR assays with EZH2, Prostein and Hepsin only showed low transcript expression levels. Presented results are dependent on limited numbers of Tu- and Tf-specimens. Collected biopsy samples were taken from 11 patients and are not matched. Differential expression of prostate-related genes The results of transcript RNA expression in malignant versus non-malignant probes are presented in Tab. 1. For all prostate-/ PCa-related transcripts the relative RNA expression levels in Tu-probes were detected higher than in Tf-tissue samples. The highest median Tu:Tf ratios were observed for AMACR (median 23-fold), DD3 (median 22-fold) and PSMA (median 10,4-fold) (Fig. 2). In contrast difference in RNA expression levels of prostein between Tu- and Tf-samples was not so significant (data not shown). Prediction for primary PCa In combination with mRNA-expression levels of EZH2, Prostein and TRP-P8 a logit model (p=exp(logit)/[1+exp(logit)] with logit= ∑rc [constant, genes]) for prediction of a primary PCa were calculated. All Tu samples were analyzed in this logit model, using the expression levels of mentioned transcript markers. With this mathematic model a prediction of PCa was possible in 77% of examined Tu samples. Conclusion For tested prostate-/ PCa-related marker genes (Tab. 1) mRNA expression levels were higher in Tu samples than in Tf specimens. The highest Tu:Tf-ratio in median expression levels were observed in AMACR, DD3 and PSMA. The application of the established logit model with calculation of expression levels from Prostein, EZH2, TRP-P8 and DD3 to expressions results of removed biopsies approved a correct prediction of PCa for 20 Tu samples (77%). For future examinations a transfer of methods and calculations to decide mRNA expresssion levels on diagnostic biopsies is aspired. It may be a further step in molecularbiological diagnostic of PCa.