Download
1 / 10
100 likes | 260 Views
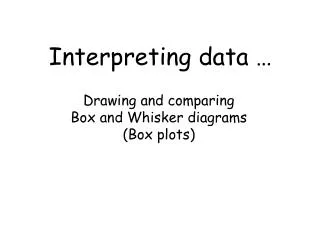
Interpreting Data Sets. ~adapted from Walch Eduction. Important Concepts…. An outlier is a data value that is much greater than or less than the rest of a data set. Outliers influence calculations related to center and spread, and can cause misleading conclusions. Practice Problem.

E N D
Interpreting Data Sets ~adapted from Walch Eduction
Important Concepts… • An outlier is a data value that is much greater than or less than the rest of a data set. • Outliers influence calculations related to center and spread, and can cause misleading conclusions.
Practice Problem Each student in Mr. Lamb’s class measured a pencil. The data set below shows the pencil lengths in centimeters (cm). What is the expected length of any given pencil? Describe the shape, center, and spread of the data.
Calculate the IQR • Find the median. • Find Q1. • Find Q3. • Find the IQR =(Q3 – Q1). 17 – 15.6 = 1.4 IQR = 1.4
Determine if there are any outliers • Multiply 1.5 times IQR. 1.5(IQR) = 1.5(1.4) = 2.1 • Determine if there are any outliers at the lower end of the data Q1– 1.5(IQR) = 15.6 – 2.1 = 13.5 • Any data values less than 13.5 are outliers. Therefore, there is one outlier: 10.2. • Determine if there are any outliers at the upper end of the data Q 3 + 1.5(IQR) = 17 + 2.1 = 19.1 • There are no values in the data set that are greater than 19.1, no more outliers. The only outlier for this data set is 10.2.
Calculate a measure of center Because there is an outlier we will use the median as a measure of center Create the box plot using the five values found earlier: minimum = 10.2; Q1 = 15.6; median = 16.1; Q3= 17; maximum = 19.0.
So… • The data is skewed left because the box plot has a long tail on the left side. This is due to the low value of the outlier, 10.2. • The spread of the data is large. Notice the width of the box compared to the width of the minimum and maximum values. • The center is better described by the median, which is not influenced by outliers. • Therefore, the approximate length of a pencil based on Mr. Lamb’s data is 16.1 cm, with a large variation in the data
Thanks for Watching!!!!!! • Ms. Dambreville