Download
1 / 25
250 likes | 261 Views
Internal City Structure. Land uses within U.S. cities vary greatly. Internal City Structure. Land Uses within Cities Classify into private and public land owners Commercial : retail stores, warehouses, malls, offices Industrial : heavy and dirty, light and clean

E N D
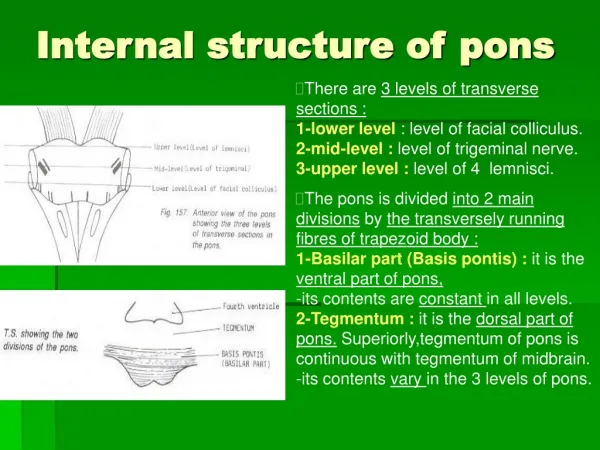
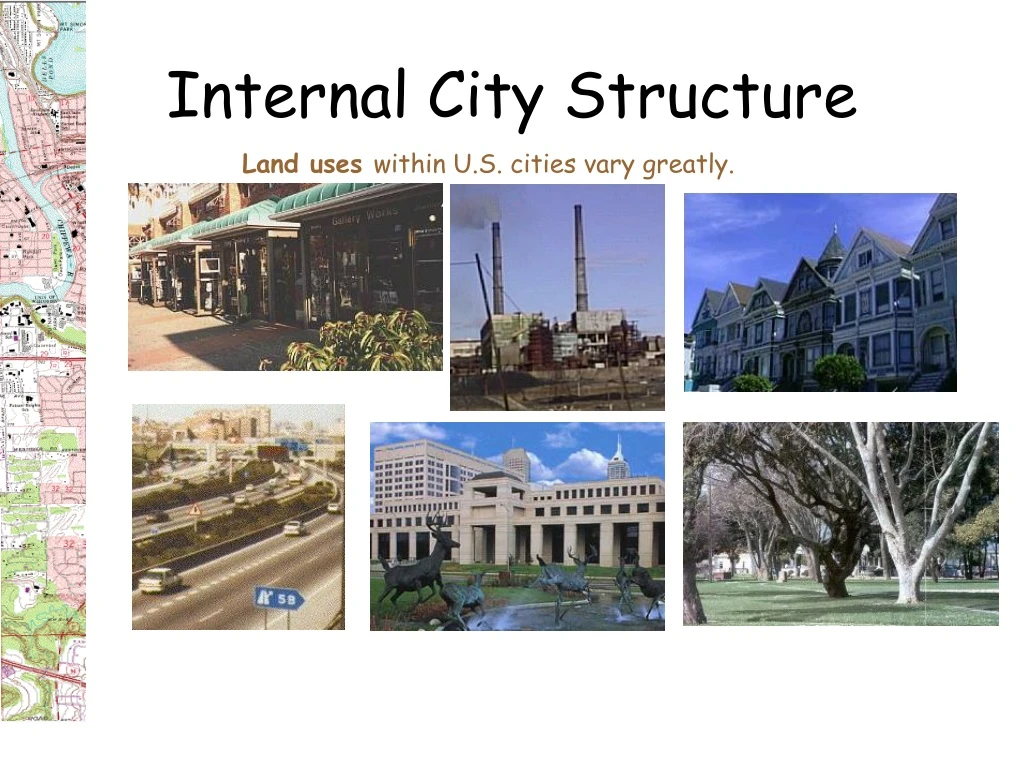
Internal City Structure Land uses within U.S. cities vary greatly.
Internal City Structure • Land Uses within Cities • Classify into private and public land owners • Commercial: retail stores, warehouses, malls, offices • Industrial: heavy and dirty, light and clean • Residential: houses, apartments, detached, attached • Transportation: streets, highways, railroads, ports, airports • Governmental: courthouses, jails, schools, colleges • Open space: parks, waste lands
Internal City Structure • Urban Land Use Theory • In a capitalist economy, competition between private land owners assures that the highest price will result in the “highest and best”land use • Land prices and, consequently, land uses reflect accessibility– how every parcel of land is theoretically related to all other parcels • the more accessible, • the higher prices and uses of land • the less accessible, • the lower prices and uses of land
Internal City Structure Three Land Use Models: Concentric Ring Model Central Business Districts (CBDs) consist of businesses, convention centers, government, warehouses, condos, gentrified areas, colleges, festival and park areas, historic districts, religious institutes, and light manufacturing.
Internal City Structure Transportation modes create different land use patterns.
Internal City Structure • Land Uses within Cities by Eras: Land Use Curve and Spatial Patterns Transportation modes only reflect private decisions and governmental policies; they do not determine land use patterns. R1 = foot travel -- circular, equal distance from the CBDR2 = street cars -- star shaped along street car tracksR3 = recreational autos -- circular, filling in areas close to the CBD but away from street car linesR4 = freeway cars -- star-like, along inter and intra state highways
Blacks Blacks Internal City Structure Three Land Use Models: Sector Model Cities added linear spatial sectors when horse-drawn and then electrified street trolleys and commuter steam trains became common from the1890s-1940s.
Internal City Structure Three Land Use Models: Multi-Nuclei Model
Internal City Structure • Land use patterns reflect private and governmental actions. • Lack of enforcement of anti-trust laws: e.g., 1936-1949 General Motors working with Firestone Tire, Standard Oil of California, and two suppliers of bus-related products created a holding company which bought electric trolley transit lines in 45 cities, including New York, Philadelphia, Baltimore, St. Louis, Salt Lake City, Oakland, and Los Angles. In 1949 a federal court found this holding company guilty of anti-trust laws and fined it $5,000! But the damage had been done -- public mass transit systems were destroyed by corporations and the federal courts.
Internal City Structure 2. Federal Highway and Interstate system: President Dwight Eisenhower, a Republican, created the Interstate system for national defense! 1956 Congress created the Highway Trust Fund, funded from gasoline and auto part taxes, used to fund over $160 billion in highway construction. No such direct funds exit for mass transit in the United States. In a related matter: Although the federal government regulates gasoline efficiency for cars, Honda Insights (gas & electric hybrids) get 60 mpg in the city and Hummers get 13! U.S. households spend 19% annually for their vehicles, second only to housing costs.
Internal City Structure 3. Federal Housing and Education Policies: Veteransafter WWII were legible for federally funded GI bills benefits: Guaranteed mortgages allowed veterans to buy houses in the suburbs. By 1947 more than four million returning veterans had taken advantage of GI benefits.
Internal City Structure 4. Federal Home-Ownership Tax Deductions: A) Today, individuals can deduct interest on up to $1 million in mortgage payments, plus interest on another $100,000 in home equity loans. This year, the deduction will sap an estimated $72.6 billion from the Treasury. B) Local property taxes can also be deducted from federal and state income taxes. Overall federal and state housing tax relief (2003): 1) $57 billion for households with $148,000 or more income2) $36 billion for poverty-level households ************************************************************* All federal tax deductions and exemptions cost the Treasury $1 trillion a year in forgone revenue, which results in either less governmental benefits and/or higher taxes for the rest of the taxpayers.
Internal City Structure House prices, 1890-2010: Household mortgage debt as percent of disposable income is now 101% whereas in Canada it is only 76% yet the percent of home ownership is about the same. House prices were low from the 1910s until the 1950s (after WWII); then spiked in 2007 only to crash in 2011.
Internal City Structure Individual Decision Making: Where do I live in a city? Every person or family divides their income into three categories: 1)living expenses, 2)housing costs, and 3) transportation costs. Housing costs: Why do the poor live in high-value inner-city residential areas? *Rent/bedroom in a 4-bedroom apartment in Metro Crossing, yielding $1,500/month
UWEC faculty UWEC students Internal City Structure Home addresses are mapped; faculty housing locations are more accurate than student housing.
Internal City Structure Individual Decision Making: Where do I live in a city? Every person or family divided their income into three categories: 1) living expenses, 2) housing costs, and 3) transportation costs Transportation costs: Average commuters take 48 minutes by public transport (average 10 passengers) but only 24 minutes by car(av. 1.6 passengers) The typical U.S. city dweller can reach only 30% of jobs in their city within 90 minutes on public transport.
Internal City Structure Who owns;who rents?
Internal City Structure U.S. Income Distribution -- consequences for home ownership, health care, education, and quality of life Class structure in the United States: 1% own more wealth than the poorest 90% 1% earn more income than the poorest 40%
Internal City Structure Since the 1970s, median worker incomes have generally declined (Graph 1). To maintain their life styles and spending, more women in families worked and families borrowed more money (credit cards, home equity loans). By 2007, only 8% workers were still union members; in 1973, it was 34%. Meanwhile productivity rose by 83%, while median wages rose only by 5% and hourly wage inequality increased by over 30%! 1 Falling worker incomes with increasing productivity resulted in more income for the elites. 2 By the early 1970s, the 0.1% of U.S. earners were, on average, paid 20 times as much as the bottom 90%; by 2006 the ratio had grown to 77 (Graph 2). This was the result of: Political donors: 81% earned more than $100,000/year; only 5% earned <$50,000 in1990s congressional elections. Income-tax rates were 90% or more in the 1970s; now the highest rates are 30%. Capital gains taxes are only 15%, which the rich and super-rich disportionately pay rather than federal income taxes. Review this material in a 4-minute Youtube video.
Internal City Structure Since the 1960s, and particularly since the 1990s (both Democratic Clinton and Republican Bush administrations created huge income tax cuts and deregulations), income inequality has steadily gone up (Graph 5). Income inequality resulted from federal and state income tax cuts and hugetax loop holes, such as wealthy people (richest 10%) who own 85% of all stocks and can pay capital gains taxes only (15%) rather than ordinary income taxes (as high as 30%) as many must do.
Internal City Structure In the USA, about 65 percent of the population thinks that income inequalities are too wide in the country. In China, the proportion is 95 percent. Countries with more evenly distributed incomes have longer-living people with lower rates of obesity, delinquency, depression, and teenage pregnancy than countries with more unequal incomes. “Real” means adjusted for inflation, what wages will actually buy.
Internal City Structure U.S. politicians and the general public keep the “American dream” (home ownership, higher standard of living for individuals and for each generation) alive even though it has been diminishing and is not sustainable. The reality of U.S. housing: 33% of U.S. households spend more than 30% of their income on housing. 13% of U.S. households spend more than 50% of their income on housing. 42% of all house buyers made no down payments in 2004. Over 60% of all new mortgages in California were interest-only (in 2004); in 2002, these were only 8% -- the “housing crisis” of 2008 in the making!!
Internal City Structure 1) The richest 1% in the USA took 19% of national income in 2012, their biggest share since 1928. 2) The top 10% of earners held a record 48.2%. During the recovery between 2009 and 2012 (2008 was the financial collapse) real family incomes rose by an average of 4.6%, though this was skewed by the: top 1% incomes rising by 31.4% 99% incomes rising by just 0.4%.
For additional graphs on U.S. income inequality, go to Mother Jones. “Share of employment by skill level” chart is from The Economist, Special Edition, The World Economy, 4 October 2014.
Where is the money in the United States?Examine these maps: http://www.census.gov/dataviz/visualizations/019/