Download
1 / 38
380 likes | 682 Views
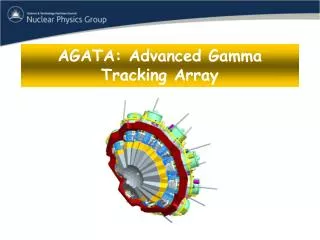
Advanced Gamma Tracking Array AGATA . Dino Bazzacco INFN Padova On behalf of the AGATA Collaboration. AGATA. 180 hexagonal crystals 3 shapes 60 triple-clusters all equal Inner radius ( Ge ) 23.5 cm Amount of germanium 362 kg Solid angle coverage 82 %

E N D
Advanced Gamma Tracking Array AGATA Dino Bazzacco INFN Padova On behalf of the AGATA Collaboration
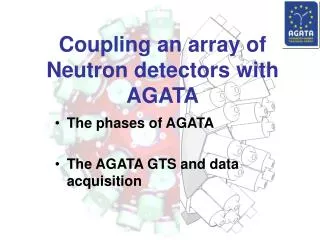
AGATA 180 hexagonal crystals 3 shapes 60 triple-clusters all equal Inner radius (Ge) 23.5 cm Amount of germanium 362 kg Solid angle coverage 82 % 36-fold segmentation 6480 segments Singles rate ~50 kHz Efficiency: 43% (Mg=1) 28% (Mg=30) Peak/Total: 58% (Mg=1) 49% (Mg=30) 6660 high-resolution digital electronics channels Detectors operated in position-sensitive mode Digital EDAQ + Pulse Shape Analysis + g-ray Tracking Coupling to ancillary detectors for added selectivity
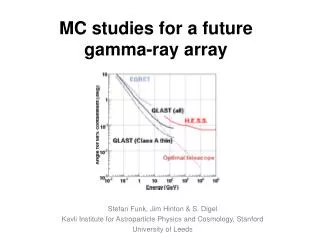
Conventional array Segmented detectors g-ray tracking Energy (keV) AGATA v/c = 50% Using the detectors in position-sensitive modewill provide very high efficiency and excellent energy resolution , making AGATA ideal for spectroscopic studies of weak channels Effective energy resolution maintained at “extreme” v/c
Mg = 30 Reconstruction of 0.1÷10 MeV gammas MC simulation of a high-multiplicity event Efficiency depends on position resolution Position resolution (FWHM, mm)
Pulse Shape Analysis concept A3 A4 A5 B3 B4 B5 C3 C4 C5 CORE measured 791 keV deposited in segment B4
Pulse Shape Analysis concept A3 A4 A5 B3 B4 B5 (10,10,46) C3 C4 C5 y B4 C4 CORE measuredcalculated D4 x A4 F4 E4 791 keV deposited in segment B4 z = 46 mm
Pulse Shape Analysis concept A3 A4 A5 B3 B4 B5 (10,15,46) C3 C4 C5 y B4 C4 CORE measuredcalculated D4 x A4 F4 E4 791 keV deposited in segment B4 z = 46 mm
Pulse Shape Analysis concept A3 A4 A5 B3 B4 B5 (10,20,46) C3 C4 C5 y B4 C4 CORE measuredcalculated D4 x A4 F4 E4 791 keV deposited in segment B4 z = 46 mm
Pulse Shape Analysis concept A3 A4 A5 B3 B4 B5 (10,25,46) C3 C4 C5 y B4 C4 CORE measuredcalculated D4 x A4 F4 E4 791 keV deposited in segment B4 z = 46 mm
Pulse Shape Analysis concept A3 A4 A5 B3 B4 B5 (10,30,46) C3 C4 C5 y B4 C4 CORE measuredcalculated D4 x A4 F4 E4 791 keV deposited in segment B4 z = 46 mm
Pulse Shape Analysis concept A3 A4 A5 Result of Grid SearchAlgorithm B3 B4 B5 (10,25,46) C3 C4 C5 y B4 C4 CORE measuredcalculated D4 x A4 F4 E4 791 keV deposited in segment B4 z = 46 mm
Examples of signal decomposition Eg = 1172 keV net-charge in A1 A B C D E F CC Eg = 1332 keV net-charge in C3, E1, E3
Status after more than 10 years of R&D • Germanium detectors • Pulse Shape Analysis • Gamma-ray Tracking • AGATA Demonstrator • Electronics and DAQ • Problems encountered • Performance • Experiments • Evolution
AGATA Crystals 80 mm 90 mm Manufactured by Canberra France Volume ~370 cc Weight ~2 kg (the 3 shapes are volume-equalized to 1%) 6x6 segmented cathode
Asymmetric AGATA Triple Cryostat - integration of 111 high resolution spectroscopy channels - cold FET technology for all signals Challenges: - mechanical precision - heat development, LN2 consumption - microphony, noise, high frequencies Manufactured by CTT Energy resolution at 1332 keV Core: 2.4 keV Segments: 2.1 keV A. Wiens et al. NIM A 618 (2010) 223–233 D. Lersch et al. NIM A 640(2011) 133-138
The AGATA Demonstrator Objective of the R&D phase 2003-2009Used for Physics at LNL in 2010-2011 5 asymmetric triple-clusters 15 36-fold segmented crystals 540 segments 555 high-resolution digital-channels Eff. 3 – 8 % @ Mg = 1 Eff. 2 – 4 % @ Mg = 30 Real time operation Pulse Shape Analysisg-ray Tracking Hosting sites LNL 2009-2011 GSI 2012-2013GANIL 2014 S. Akkoyun et al. NIM A 668 (2012) 26–58 A. Gadea et al. NIM A 654 (2011) 88-96
AGATA Demonstrator + PRISMAinfrastructure at completed mid 2009, all clusters in place May 2011
AGATA: Structure of Electronics and DAQ Fast 1st Level Trigger Clock 100 MHz T-Stamp PSA farm Other detectors Control, Storage… TRACKING DIGITIZER PREAMPL. Other Detectors GL Trigger Digital preamplifier concept 200MB/s/seg. Detector Level GTS GTS Core + 36 segments Processing Processing High throughput pre-processing For one crystal: 2 ATCA carriers 1 GTS + 7 processing mezzanines 100MB/s/detector Processing LAN Global Level DAQ-NARVALRUN- & SLOW-Control EVENT BUILDER Other detectors:interface to GTS, merge time-stamped data into event builder, prompt local trigger from digitisers
GTS : the system coordinatorAll detectors operated on the same 100 MHz clock Downwards 100 MHz clock + 48 bit Timestamp (updated every 16 clock cycles) Upwards trigger requests, consisting of address (8 bit) and timestamp (16 bit) max request rate 10 MHz total, 1 MHz/detector Downwards validations/rejections, consisting of request + event number (24 bit)
Some important issues • Cross talk among the channels of one crystal • Need to run at very high counting rates • Neutron damage and degradation of energy resolution of the segments • Annealing of crystals to restore the original energy resolution is a delicate procedure
Sum of segment Energies vs fold Energy [keV] Segment sum energies projected on fold 2-folds : centroid of Core and Segment-sum …all 1260 possible 2-fold combinations Crosstalk • Crosstalk is present in any segmented detector • Creates strong energy shifts proportional to fold • Tracking needs segment energies !
High counting rate • The detection efficiency of AGATA is, so far, provided by a small number of crystals. Experiments want to collect big statistics and push for running at high singles counting rates. • Thanks to digital signal processing, we can work in conditions impossible with conventional electronics. • Under these «extreme» conditions, the performance of the detectors is still acceptable. • A limit exists, due to pileup of the signals which exhaust the dynamical range of the FADC. Counteract this by reducing the gain of the preamplifiers but then energy resolution worse also at low counting rate.
Singles rates and shaping time 6 different rates x 4 trapezoid risetimesx 6 BLR lengths Two independent sources of dead-time: pile-up rejector and GTS 60Co - fixed 137Cs – 6 positions Francesco Recchia, Padova
Neutron damage: shape of the 1332 keV line Blue: April 2010 FWHM(core)~2.3 keV FWHM(segments) ~2.0 keV Red: July 2010 FWHM(core) ~2.4 keV FWHM(segments) ~3 keV Damage after 3 high counting-rate experiments (3 weeks of beam at 30-80 kHz singles) Worsening seen in most of the detectors; more severe on the forward crystals; segments are the most affected, cores almost unchanged (as expected for n-type HPGe)
Crystal C002 corrected April 2010 July 2010 CCr=15mm SGr=15mm CCr=15mm SGr=15mm The 1332 keV peak as a function of crystall depth (z) for interactions at r = 15mm The charge loss due to neutron damage is proportional to the path length to the electrodes. The position is provided by the PSA (which is barely affected by the amplitude loss). Knowing the path, the charge trapping can be modeled and corrected away (Bart Bruyneel, IKP Köln)
Energy resolution at the end of the LNL campaignBeforeand After charge-trapping correction Core Sum of 15 spectra FWHM 3.2 keV 2.8 keV FWTM 7.2 keV 5.6 keV Segments Sum of 15*36=540 spectra FWHM 5.5 keV 2.9 keV FWTM 15.5 keV 6.8 keV Eg (keV) Undamaged detectors: FWHM ~2.5 keV, FWTM ~4.8 keV
Performance of the AGATA Demonstrator Just a few examples
Doppler Correction Capability, “small” v/c220 MeV 56Fe 197Au (ATC1 + DANTE, July 2009) 56Fe 2+ 0+ 846.8 keV Au recoils also seen by Dante 56Fe 4+ 2+ 1238.3 keV 4.8 keV FWHM Original Corrected Doppler correction using PSA (AGS) and trackingFWHM = 3.5 keV (3.2 keV using only single hits) v/c 8% E(2+) = 846.8 keV Doppler correction using center of hit segments FWHM = 7 keV Detector FWHM = 2.2 keV Doppler correction usingcenter of crystals FWHM ~20 keV Eg (keV)
Doppler Correction Capability, “large” v/cinelastic scattering 17O @ 20 MeV/u on 208Pb 16O Charged particles detected in TRACE No Doppler Corr. Crystal Centers SegmentCenters PSA+Tracking F O N v/c 20% C dE (MeV) B Be Li a TKE (MeV) Fabio Crespi, Milano
gg capabilities 135 MeV 32S 110Pd (6 AGATA crystals only) The performance of AGATA using g-ray tracking is comparableto conventional arrays with a much larger number of crystals 138Sm 6 gates on:347keV,545keV,686keV,775keV,552keV,357keV 871 keV 22+ - 20+
Imaging of Eg=1332 keV gamma raysAGATA used as a big Compton Camera Far Field Backprojection All 9 detectors One detector Near Field Backprojection All 9 detectors One detector Source at 51 cm Dx ~Dy ~2 mm Dz ~2 cm Francesco Recchia
neutrons protons The Experimental Campaign at LNL Octupole-deformedRa and Th nuclei Neutron-rich nuclei in the vicinity of 208Pb n-rich Th and U Isospin Mixingin 80Zr Pygmy and GQR states Neutron drip-line g.s. rotationin Dy, Er, Yb High-lying statesin 124Sn and 140Ce Shape transition in 196Os Molecular structure of 21Ne n-rich nuclei Order-to-chaos transition in 174W Proton drip-line Lifetimeof 136Te N=84 isotone140Ba Coulexof 42Ca N=51 nuclei Neutron-rich nuclei populated by fission 20exp.148 days Lifetimes of the n-rich Cr isotopes Lifetimes in n-rich Ni, Cu and Zn isotopes Lifetimes near the island of inversion Lifetime of the 6.792MeV state in 15O
From the Demonstrator to AGATA 1πPlans for the next few years LNL: 2010-20115 TC Total Eff. ~6% GSI: 2012-2013≥ 5 TC + 5 DC Total Eff.~10% GANIL: 2014-201515 TC Total Eff. ~15% AGATA D.+PRISMA AGATA + FRS AGATA+VAMOS
Status of AGATA at GSI • Mechanics & detector support infrastructure • 7 crystals (2 DC, 1 TC) used in the 3rd commissioning test (May 23-28). more detectors added in the next few months. • Electronics and DAQ ready for 15 crystals • Second batch of electronics modules under test to instrument the up 25 crystals. • Coupling to FRS, LYCCA, HECTOR done. First experiments Q4 2012
The AGATA Collaboration Bulgaria: Sofia Finland:Jyväskylä France: GANIL, Grenoble, Lyon, Orsay, Saclay, Strasbourg Germany:Darmstadt, GSI, Köln, München Italy: Firenze, LNL, Milano, Padova Poland: Krakow, Warsaw Romania: Bucharest Spain: Valencia, Madrid, Salamanca Sweden:Göteborg, Lund, Stockholm, Uppsala Turkey: Ankara, Istanbul UK:Brighton, Daresbury, Edinburgh, Liverpool, Manchester, Paisley, Surrey, York
First implementations of theg-ray tracking array concept AGATA Demonstrator GRETINA 15 crystals in 5 Triple Clusters Commissioned in 2009 at LNL (with 3 TC) Experiments at LNL in 2010-2011 Being reinstalled and expanded at GSI 28 crystals in 7 Quadruple Clusters Engineering runs started early 2011 at LBNL Experiments at LBNL in 2011 Being reinstalled at NSCL