Download
1 / 6
60 likes | 275 Views
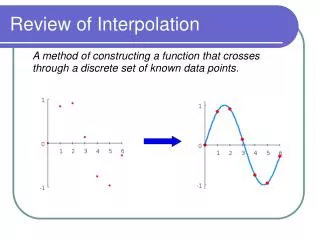
Interpolation of polar field. Y. Liu, J. T. Hoeksema, X. P. Zhao, R. M. Larson – Stanford University yliu@solar.stanford.edu. Interpolation of the polar regions. 1D cubic spline interpolation (Xuepu’s method) Potential field method (Xuepu’s method)

E N D
Interpolation of polar field Y. Liu, J. T. Hoeksema, X. P. Zhao, R. M. Larson – Stanford University yliu@solar.stanford.edu
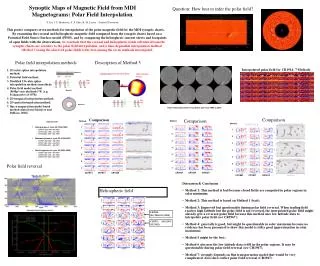
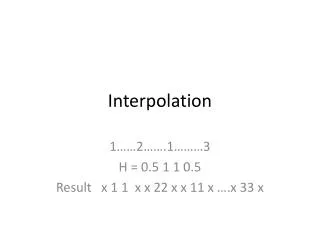
Interpolation of the polar regions • 1D cubic spline interpolation (Xuepu’s method) • Potential field method (Xuepu’s method) • Modified 1D cubic spline interpolation (smooth) • Polar field model method: B=Bp*cos(colatitude)^8 (suggested by many others) • Using observed polar field data. • Select the synoptic charts when the polar regions are well observed (generally one synoptic chart per year for one pole region); • Transform the data into the polarview plane; • Use a least-square-based algorithm to do a surface fitting (algorithm and code are from Rasmus); • Transform the fitting data into the Carrington coordinate; • Thus we have one modeled polar field distribution per year; • Using 1D cubic spline interpolation to fill in the missing-data areas of the synoptic maps based on the modeled polar field data. • 2D interpolation (least-square-based algorithm from Rasmus) • Flux transport equation based method.
Data for test • Rising phase of cycle 23 (1996-1997) • CR1914 ( Sep 1996– Oct 1996) • CR1917 (Dec 1996 – Jan 1997) • CR1920 (Mar 1997 – Mar 1997) • Maximum phase of cycle 23 (2000-2001) • CR1967 (Sep 2000 – Sep 2000) • CR1971 (Dec 2000 – Jan 2001) • CR1974 (Mar 2001 – Apr 2001) • Declining phase of cycle 23 (2004-2005) • CR2021 (Sep 2004 – Oct 2004) • CR2024 (Dec 2004 – Dec 2004) • CR2027 (Feb 2005 – Mar 2005)
Method Comparison 1 2 3 4 5 6 7 CR1914 CR1917 CR1920
Method Comparison 1 2 3 4 5 6 7 CR1967 CR1971 CR1974
Method Comparison 1 2 3 4 5 6 7 CR2021 CR2024 CR2027