Download
1 / 14
140 likes | 142 Views
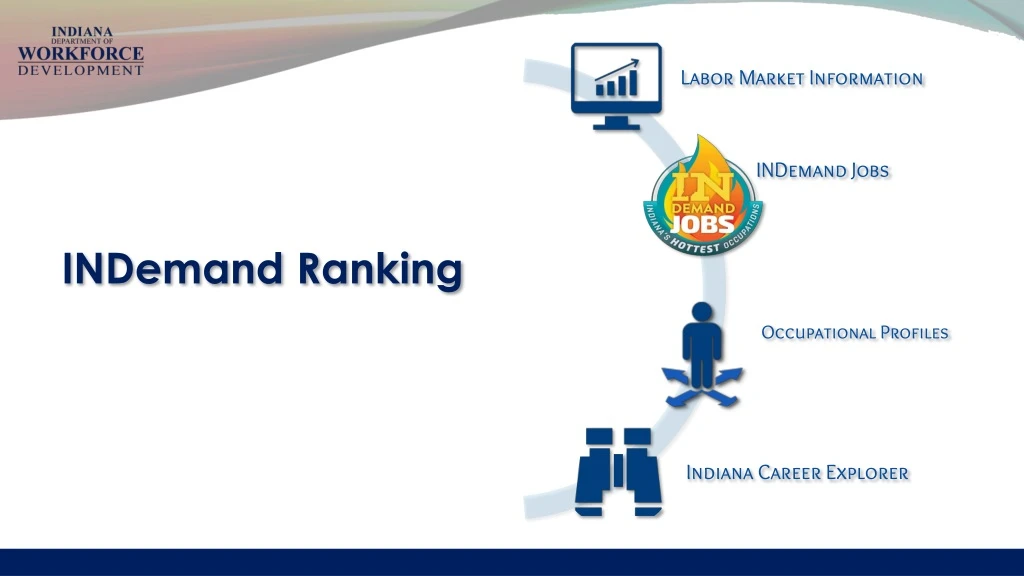
INDemand Ranking provides a comprehensive list of future high-demand jobs based on projected demand, wages, and real-time labor market data. It uses a unique scoring system to determine the rankings. Find out the top occupations in Indiana!

E N D
INDemand Jobs are based on future demand, percent change, wages, and real time labor market information
Occupational Projections Projection inputs include state and national variables State level • Covered and non-covered employment time series • Variables, i.e. Labor Force, Initial claims, Indiana leading index, Personal Income, Population, etc • Occupation staffing ratios per industry • Economic development activity National level • National occupation-specific change and utilization rates by industry, i.e, effects from automation, robotics, offshoring, technology, etc. • National Projections • Variables, i.e. GDP, United States Labor Productivity, Prime interest rate %, Housing Starts, etc Occupational projections are produced at the state level within a national consortium, The Projections Managing Partnership is funded by the U.S. Employment and Training Administration. Indiana is represented on the PMP Board.
INDemandRanking Methodology Inputs • Short Term Total Projected Openings (33.33%) • Short Term Growth Openings (16.67%) • Short Term Percentage Change (16.67%) • Job Postings (16.67%) • Wages* (16.67%) • Long Term Total Projected Openings (40%) • Long Term Growth Openings (20%) • Long Term Percentage Change (20%) • Wages* (20%) Long Term Score Short Term Score Average Score = INDemand Ranking *As to wages, any occupation scoring 3 or 4 in the wage category cannot score higher than 3 Flames and any occupation scoring 1 or 2 in the wage category cannot score higher than 2 Flames. (Source: National Wages were used for occupations with wages suppressed in Indiana)
INDemand Decile Ranking Method For both short term projections and long term projections, each occupation is assigned a 1-10 score in each of the five categories by ranking how it performs in comparison to every other occupation in Indiana. The scoring method is determined by deciles, or in other words, a percentile system ranging from the 90th percentile and above, down to the 10th percentile and below. The score is weighted by category for both the short term and long term projected outlooks and then averaged to provide a final composite score. Registered Nurse 29-1141 *As to wages, any occupation scoring 3 or 4 in the wage category cannot score higher than 3 Flames and any occupation scoring 1 or 2 in the wage category cannot score higher than 2 Flames. (Source: National Wages were used for occupations with wages suppressed in Indiana)
What’s Included? What’s Not? Education attainment or training value Job vacancy or skills gap surveys Supply vs demand gap Number of openings threshold Skills/Competencies • Real time labor market analytics • Short and long term future projected demand • Rate of growth • Number of growth openings • Occupational change rates due to automation, changes in business practices, technological innovation, mergers & outsourcing • Economic development activity • Labor force projections • Wages
Real Time Labor Market Information • Real time labor market information is used to help understand local labor market patterns and opportunities • Burning Glass Technologies is the leading source for Real Time LMI • Codes millions of job postings from more than 40,000 online sources daily
HOW DO STATES MEASURE In Demand JOBS? • 80% - projected job openings • More states took an ordinal approach, ranking occupations by number of projected job openings, than taking a cardinal approach (only looking at occupations with at least 1,000 projected job openings, for example) • 69% - growth rate from employment projections • 51% - online job ads • 31% - targeted industries • 29% - supply and demand analysis • 22% - job vacancy, skills gap, or other employer surveys • Note: 63% use a composite method of more than one metric • Source: Bureau of Labor Statistics State Survey, 2017
HOW DO STATES MEASURE In Demand JOBS? • States refine their lists with certain metrics: • 75% - occupational wages • Usually mean or median OES wage for the state • 53% - education and training levels • Some states have several lists of jobs in demand covering different levels • 24% - base year minimum employment cutoff • 22% - projected number of new jobs Results of the BLS survey (Continued)
Other FORMULA scenarios – outcomes • Double weighting OPENINGS • Current methodology • 90% occupations within 5 flame occupations were in the 75th percentile or above of wages • Wage rule prevents high churn, low pay occupations from elevating to 4 or 5 flame occupations • Current wage rule prevents low wage, high demand occupations from elevating on the ranking list • Double weighting the openings (to highlight high demand occupations within a range of education attainment level categories) elevated occupations requiring more than a high diploma • Post-secondary certificates are best represented by the current double-weighted demand method. Indiana would lose four 5 flame post-secondary certificate openings by moving to the single weighted opening methodology, and all post-secondary certificates are removed from the 5 flame category when using the double weighted wage method. • Double weighting WAGES • Bias towards Bachelor’s and even Master’s degree requirements • De-emphasizes jobs with an Associate’s degree, Certificate, or less, especially impacting Healthcare occupations, where the need is great • May misrepresent demand on EGR level rankings • (some EGRs do not have a robust representation in key industries – there would be misrepresentation of the demand when wage is driving the rankings, especially at the regional level) • Single weighting DEMAND • Equals a definite opportunity for job seekers • Water down demand opportunities by volume, but would be more holistic in terms of varying education attainment levels than double weight of wages
Contact Information Fran Valentine Sr. Director, Research Analysis & Engagement Indiana Department of Workforce Development Fvalentine1@dwd.in.gov