Download
1 / 20
200 likes | 203 Views
This article provides a summary of the extreme precipitation event in Washington State from 25-30 November 2014, focusing on the flooding and flood control operations. The rainfall totals, river flow data, and dam operations are discussed, highlighting successful flood control measures and areas of impact. Additionally, the article mentions the orographic enhancement of rainfall and the role of atmospheric rivers in the event. The text is in informal language.

E N D
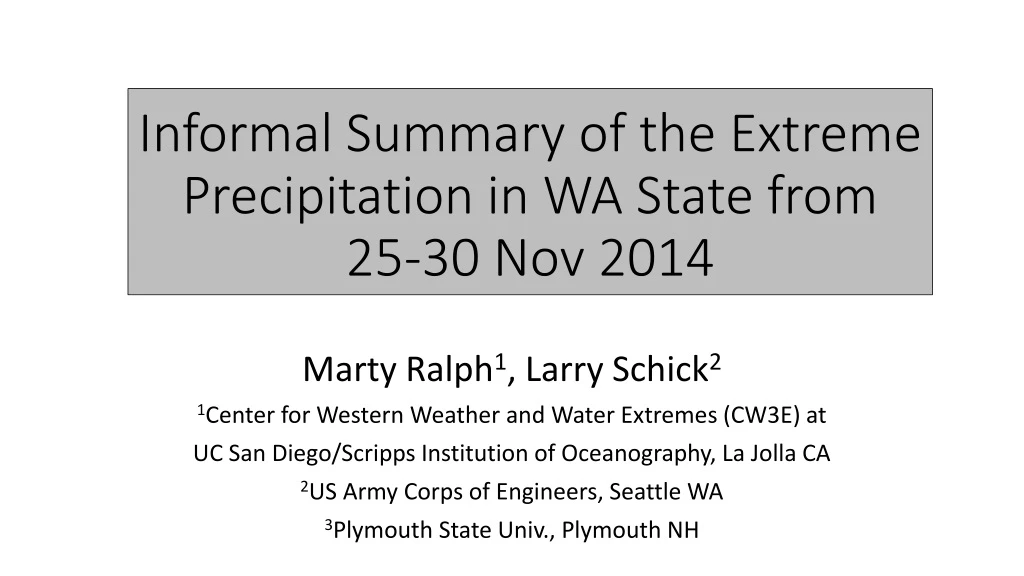
Informal Summary of the Extreme Precipitation in WA State from 25-30 Nov 2014 Marty Ralph1, Larry Schick2 1Center for Western Weather and Water Extremes (CW3E) at UC San Diego/Scripps Institution of Oceanography, La Jolla CA 2US Army Corps of Engineers, Seattle WA 3Plymouth State Univ., Plymouth NH
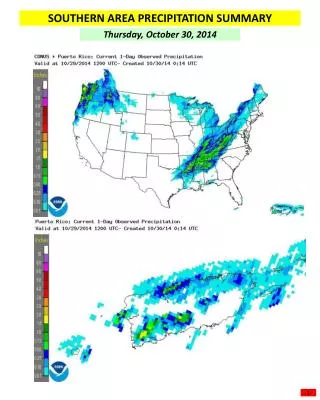
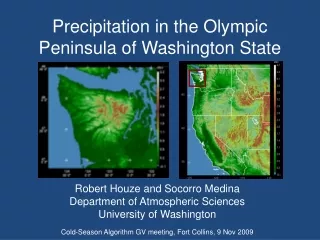
An “R-CAT 2” Event* Precip. ending 8 AM MST 28 Nov 2014 Easy Pass, WA, SNOTEL 5270 ft 24-hour total precipitation 13.0 inches in 72 h ending 8 AM MT 28 Nov 2.5, 3.3, 7.2 in/day starting 700 AM 25 Nov Temps: 33-40 F The rainfall totals clearly show the orographic enhancement of rainfall, with a rain shadow in Seattle and high values in surrounding mountains *R-Cat 2 events are those for which max 3-day precipitation is from 300-400 mm (about 12-16 inches) The R-Cat precip. scaling method is described by Ralph and Dettinger 2012 (Bull. Amer. Meteorol, Soc.)
28 November 2014 NW Washington Flooding Exceeds flood stage Seattle
Comparison between NWRFC predicted (>1 day lead time) and observed peak flow
Skagit River (near Mount Vernon, WA) Flood of 28-30 Nov 2014 Flood stage: 28 ft (~70,000 cfs) Observed peak on 29 Nov 2014: 31 ft (~90,000 cfs)
27 Nov AM 25 Nov AM 26 Nov AM 27 Nov PM 25 Nov PM 26 Nov PM 55 N SSM/I IWV 27 Nov 2014 PM orbits • Atmospheric river involved • SSM/I images show landfall on 27 Nov • 27 Nov had about 60% of the 3-day total • SW orientation of AR favored N. Cascades • Mesoscale frontal wave may have stalled AR • High snow level (40 F at 5270 ft on 27 Nov) • 25-26 Nov apparent warm frontal precip. • Warm for all 3 days (>32 F at 5270 ft MSL) Flooding from R-Cat 2 rain event (13 in/3 days) 35 N 15 N 160 W 130 W 100 W
Flood operations - event summary • Successful moderate/major flood control operations on the Skagit river, by the USACE Seattle. This was the first flood control activation, of this magnitude, for the Skagit basin in many years. Weather and hydro forecasts were generally good, with some timing issues. Minor levee damage. Typical lowland localized river flooding was seen. USACE - Seattle flood operations also lowered flows on Green and White rivers below HHD and MMD. • Earlier in the event(nov 25/26), warm front produced well forecast Cascades 2-5”. But focused higher intensity 4-7”, not well forecasted. • Produced very high flows near Mt Rainier Nat Park with road damage. Plus, very high flows on Puyallup at Orting gage. No damage at Orting.
Flood operations - details • The AR weather event of Nov 26-28 caused the Seattle USACE Water Management Reservoir Control Center (for flood control) and USACE Emergency Management Center(assisting locals with flooding issues) to be activated on a 24 hour basis for three days. We operated four dams (Howard Hanson/Mud Mountain/Upper Baker/Ross) and stored water for flood control in each, to assist in downstream flood risk management. The Ross and Upper Baker flood storage operations took off about 35,000 cfs from the Concrete gage peak on the Skagit river. Wynoochee dam on the Olympic Peninsula was not needed for flood control as rainfall and stream flows increases were not noteworthy in that area. • The warm front rainfall on Nov 25/26, came in as forecast (2-5") mainly Central Cascades. We did have some more intense rainfall for a time around the Mt Rainier area with 4-7" totals – more intense the morning of the 26th. The Puyallup river at Orting gage, experienced a > 25 year flood event with this peak flow in their top 4 peaks of all time, with a long record. Levee assistance/flood monitoring was provided by the UACSE, no major issues. Also USACE Mud Mountain dam provided flood storage and protection downstream on the Puyallup river. USACE Howard Hanson Dam stored water and protected the Green River valley from flooding. Impressive .40” of rain per hour (four hours straight at HHD) on early morning of Nov 26.
Flood operations - Skagit River • The AR event of the 27/28 of Nov, targeted the North Cascades with a more southerly angle of attack. NWRFC forecasts indicated a natural(without dams) flow over 90,0000cfs at the Concrete gage and that is our threshold to take over Upper Baker and Ross dams to operate for flood control, which we did. Our successful operations lowered the peak at Concrete (by about 35,000cfs) which translated to downstream flows lowered through the Skagit Valley and at Mt Vernon, saving the valley from serious flooding.
Flooding near Mt. Rainier The surprise was the impressive peak at Orting flow which far exceeded the earlier forecast. Some damage to roads was reported in nearby Mt Rainier National Park http://www.nps.gov/mora/parknews/entrance-closed-for-flooding.htm related news video and story http://www.komonews.com/news/local/Flooding-triggers-evacuations-at-Mt-Rainier-Natl-Park-283873271.html
Selected references relevant to this diagnosis • Neiman, P. J., F. M. Ralph, G. A. Wick, Y.-H. Kuo, T.-K. Wee, Z. Ma, G. H. Taylor, and M. D. Dettinger, 2008: Diagnosis of an intense atmospheric river impacting the Pacific Northwest: Storm summary and offshore vertical structure observed with COSMIC satellite retrievals. Mon. Wea. Rev., 136, 4398-4420. • Ralph, F. M., P. J. Neiman, G. N. Kiladis, K. Weickman, and D. W. Reynolds, 2011: A multi-scale observational case study of a Pacific atmospheric river exhibiting tropical-extratropical connections and a mesoscale frontal wave. Mon. Wea. Rev., 139, pp. 1169-1189, doi: 10.1175/2010MWR3596.1. • Neiman, P. J., L. J. Schick, F. M. Ralph, M. Hughes, G. A. Wick, 2011: Flooding in Western Washington: The Connection to Atmospheric Rivers. J. Hydrometeor., 12, 1337-1358, doi: 10.1175/2011JHM1358.1. • Ralph, F. M., and M. D. Dettinger, 2012: Historical and national perspectives on extreme West Coast precipitation associated with atmospheric rivers during December 2010. Bull.Amer. Meteor. Soc., 93, 783-790. • White, A. B., B. Colman, G. M. Carter, F. M. Ralph, R. S. Webb, D. G. Brandon, C. W. King, P. J. Neiman, D. J. Gottas, I. Jankov, K. F. Brill, Y. Zhu, K. Cook, H. E. Buehner, H. Opitz, D. W. Reynolds, L. J. Schick, 2012: NOAA's Rapid Response to the Howard A. Hanson Dam Flood Risk Management Crisis. Bull. Amer. Meteorol. Soc.,93, 189-207, doi: 10.1175/BAMS-D-11-00103.1. • Neiman, P.J., D.J. Gottas, A.B. White, L.J. Schick and F.M. Ralph, 2014: The use of snow-level observations derived from vertically profiling radars to assess hydrometeorological characteristics and forecasts over Washington’s Green River basin. J. Hydrometeor., 15, 2522-2541.