Download
1 / 27
270 likes | 325 Views
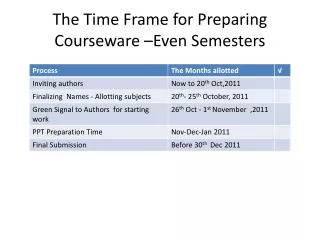
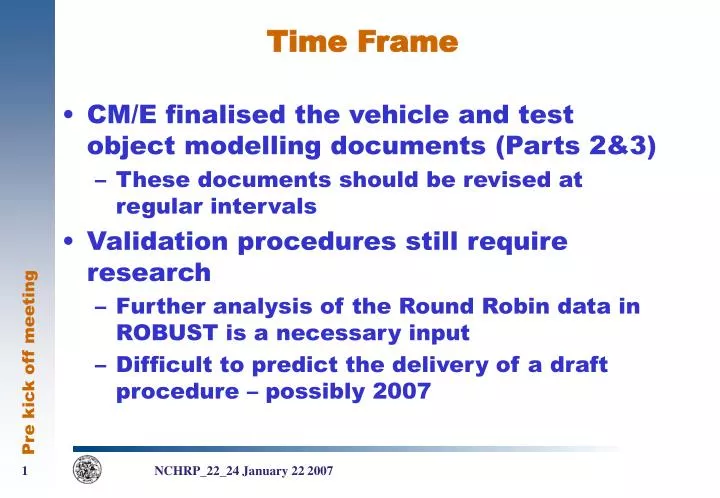
Time Frame. CM/E finalised the vehicle and test object modelling documents (Parts 2&3) These documents should be revised at regular intervals Validation procedures still require research Further analysis of the Round Robin data in ROBUST is a necessary input

E N D
Time Frame • CM/E finalised the vehicle and test object modelling documents (Parts 2&3) • These documents should be revised at regular intervals • Validation procedures still require research • Further analysis of the Round Robin data in ROBUST is a necessary input • Difficult to predict the delivery of a draft procedure – possibly 2007 1 NCHRP_22_24 January 22 2007
Validation. • If we want to use CM for the certification of a system which are the requirements for a “validated” model? • Validation should be based on a comparison between test and simulation using: • Severity indices. • Barrier performance: • Deformation. • Failures. • Vehicle trajectories. • Vehicle time histories (acceleration yaw ratio …) • ….. • Validation methods MUST be able to validate also tests repetition. 2 NCHRP_22_24 January 22 2007
Validation • The problem is how to define an objective procedure to compare time histories. • Direct comparison between avcceleration has been already demonstrated to be not applicable. Is not possible to find an objective way to compare such different curves. • Other approaches: • Statistical approach (Chalmers software). • Velocity. • Chalmers software: • Statistical comparison between a master and a signal to be tested. • The comparison is based on 8 statistical indices. 3 NCHRP_22_24 January 22 2007
CFC 60 • 3 over 8. We could relax the limits. But with no statistical meaning. 4 NCHRP_22_24 January 22 2007
Filtered at 12.5 hz • Always 3 over 8 5 NCHRP_22_24 January 22 2007
Different experimental test • Worse condition. Different requirements in the second phase? 6 NCHRP_22_24 January 22 2007
Only the first phase.Always the same problem. • Minimum peak fails even if is less important. 7 NCHRP_22_24 January 22 2007
First phase. • Only way to pass all the tests. • First part of the impact and relaxation of limits. 8 NCHRP_22_24 January 22 2007
Two experimental tests • 4 over 8! 9 NCHRP_22_24 January 22 2007
Other possibility • Window obtained from test where simulation must be contained. • Not easy to justify a window (delta time, delta g, filtering) 10 NCHRP_22_24 January 22 2007
Other possibilty 3.Final consideration • Compare two velocity time histories (experimental and numerical). • If the difference between these two time histories become greather than X(t)% your model is validated until this time. • After this time your model is not validated. • We are applying this approach also to the deformable barrier and to other impacts 11 NCHRP_22_24 January 22 2007
Validation. • Comparison based on local velocity components. • Reference frame is not inertial. • Accelerations evaluated on a reference system “mounted” on the vehicle. • To proper evaluation of velocity relative mechanics should be used. • Comparison based on global velocity components. • Planar motion. • Need of yaw rotation (not filtered). • Evaluation of global components of velocity (interpretation less immediate) 12 NCHRP_22_24 January 22 2007
Vehicle rotation X X X X α α α x y x x x Y y y y Vy Local Vy Global 13 NCHRP_22_24 January 22 2007
Round Robin. • Rigida barrier h=800 mm. • Tb11 • 900 kg • 20° 14 NCHRP_22_24 January 22 2007
Round Robin 1. Same new vehicle. Only exp. results 15 NCHRP_22_24 January 22 2007
Round Robin 2 • Different not new vehicles 16 NCHRP_22_24 January 22 2007
Robust 4.3 • Two more tests on RR1 17 NCHRP_22_24 January 22 2007
All the tests. • Same rigid barrier. • Different vehicles. • 12 nominally identical. 18 NCHRP_22_24 January 22 2007
Round Robin. Test and simulation • Not so bad. • Friction influence. (Not understood from acceleration comparison). 19 NCHRP_22_24 January 22 2007
Rigid barrier results • Components • Vy global: good agreement between tests • Vx global: scatter between tests (exit velocity is different) • Vz global: less significative. • Seems to work. 20 NCHRP_22_24 January 22 2007
Deformable barrier. • Task 4.1 Robust. • N2 barrier (max 1500 kg 110 km/h 20°). • Different vehicles. • Gorund differences. 21 NCHRP_22_24 January 22 2007
Yaw angle X X X X α α α x y x x x Y y y y Angle 22 NCHRP_22_24 January 22 2007
Yaw angle problems during tests 23 NCHRP_22_24 January 22 2007
Comparison. 24 NCHRP_22_24 January 22 2007
Comparison 1 • Dynamic deflection (ground) • Curve 1 (blue)=0.9m • Curve 3 (red)=0.7m • Difference 25% 25 NCHRP_22_24 January 22 2007
Tests and simulation 26 NCHRP_22_24 January 22 2007
Conclusion • From Round Robin encouraging results. • From deformable barrier results not acceptable. • Problem: • With these results (deformable) window to accept simulation is too wide. • According to 1317 these tests are equivalent. Means that a simulation with these differences is validated? 27 NCHRP_22_24 January 22 2007