Download
1 / 39
390 likes | 393 Views
This report provides an overview of the population and economic characteristics of Western Ontario CFDC in 2011, including population growth, age structure, education levels, income levels, and housing costs. Data is sourced from Statistics Canada Census of Population and National Household Survey.

E N D
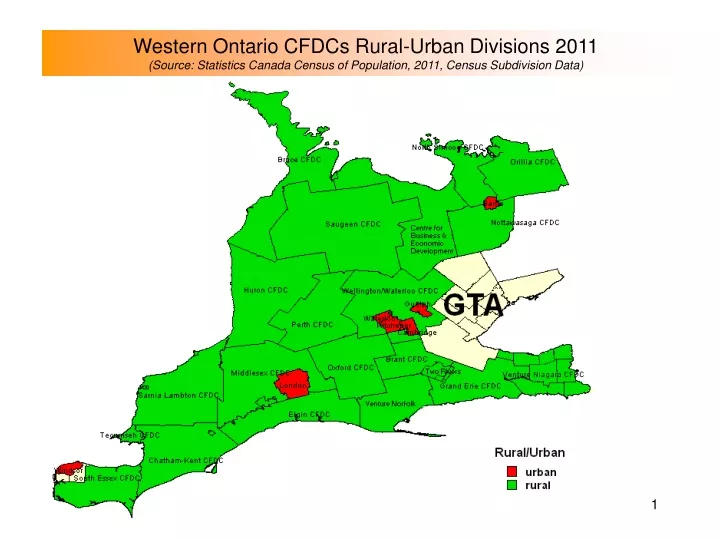
Western Ontario CFDCs Rural-Urban Divisions 2011 (Source: Statistics Canada Census of Population, 2011, Census Subdivision Data)
Western region CFDC population in 2011 (Source: Statistics Canada Census of Population, 2011, Census Subdivision Data) Ontario: ~12.85 million Urban: ~6.26 million Western CFDC: ~2.11 million
Population Gain/Loss 2006-2011 (Source: Statistics Canada Census of Population for Ontario, 2006 & 2011) Ontario: 822,925 Urban: 428,930 Western CFDC: 73, 950 Gained population
Population % Growth, 2006-2011 (Source: Statistics Canada Census of Population, 2011, Census Subdivision Data) Ontario: 6.8% Urban: 7.4% Western CFDC: 3.4%
Population % Growth, 2006-2011 (Source: Statistics Canada Census of Population for Ontario, 2006-2011, Census Subdivision Data) Ontario 6.8% nUrban nWestern Ontario CFDC
Dependency Ratio* for 2011 (Source: Statistics Canada Census of Population, 2011, Census Subdivision Data) Dependency Ratio* for 2011 (Source: Statistics Canada Census of Population, 2011, Census Subdivision Data) Ontario: 46.2 Urban: 44.0 Western CFDC: 52.7 *The dependency ratio is an estimate of the population not eligible for labor market participation relative to the population that is. The higher the dependency ratio, the higher the number of people who need to be supported by those of working age.It is calculated as follows: The population under 15 and over 65 years, divided by the total working age population (15-64 years).
Age Structure of the Population in 2011 (Source: Statistics Canada Census of Population for Ontario, 2011, Census Subdivision Data) 7
Age Structure of the Population in Western Ontario in 2011 (Source: Statistics Canada Census of Population, 2011, Census Subdivision Data) 8
Proportion of the Population of Working and Non-Working Age in 2011 (Source: Statistics Canada Census of Population, 2011, Census Subdivision Data) 9
Proportion of the Population under 15 years in 2011 (Source: Statistics Canada Census of Population, 2011, Census Subdivision Data) Ontario: 17% Urban: 17.1% Western CFDC: 16.9%
Proportion of the Population Over 65 Years in 2011 (Source: Statistics Canada Census of Population, 2011, Census Subdivision Data) Ontario: 14.6% Urban: 13.4% Western CFDC: 17.3%
Proportion of the Population that is “Working Age” (15-64 yrs old) in 2011 (Source: Statistics Canada Census of Population, 2011, Census Subdivision Data) Ontario: 68.4% Urban: 69.5% Western CFDC: 65.8%
Highest Level of Education Population Aged 25 to 64 in 2011 (Source: Statistics Canada Census of Population, 2011, Census Subdivision Data)
Highest Level of Education Population Aged 25 to 64 in 2011 (Source: Statistics Canada, National Household Survey, 2011, Census Subdivision Data)
Incidence of Low Income Families* in 2011 (Source: Statistics Canada, National Household Survey, 2011, Census Subdivision Data) Ontario: 11.7% Urban: 10.7% Western CFDC: 7.5% *2011 Low Income Measure: For this measure, the income used is after-tax income of households. All household members are considered to share the household income and are attributed the same income status.
Incidence of Low Income Families* in 2011 (Source: Statistics Canada, National Household Survey, 2011, Census Subdivision Data) Ontario 13.9% nUrban nWestern CFDC
Average Household Income in 2011 (Source: Statistics Canada, National Household Survey, 2011, 20% profile, Census Subdivision Data) Ontario: $66,836 Urban: $61,117 Western CFDC: $60,247 Note: A “household” consists of a person or persons, who occupy the same dwelling. It may be a family, multiple families, or unrelated individual(s).For census purposes, every person is a member of one household.
Average Household Income in 2011 (Source: Statistics Canada, National Household Survey, 2011, Census Subdivision Data) Ontario $85,772 nUrban nRural
Average Gross Rent, 2011 (Source: Statistics Canada, National Household Survey, 2011, Census Subdivision Data) Ontario: $753 Urban: $681 Western CFDC: $615 Note: Includes rent, heat, hydro & other municipal services where applicable.
Average Owner’s Major Payments, 2011 (Source: Statistics Canada, National Household Survey, 2011, Census Subdivision Data) Ontario: $964 Urban: $916 Western CFDC: $807 Note: Includes mortgage payments, heat, hydro and taxes and other municipal services where applicable.
Percentage of Income Derived from Government Transfer Payments* (Source: Statistics Canada, National Household Survey, 2011, Census Subdivision Data) Ontario: 9.8% Urban: 10.2% Western CFDC: 16% * Refers to total income from all transfer payments received from federal, provincial or municipal governments. Includes such benefits as Canada Pension Plan, Unemployment Insurance, Child Tax Benefit etc.
Percentage of Income Derived from Government Transfer Payments* (Source: Statistics Canada, National Household Survey, 2011, Census Subdivision Data) Ontario 12.3% *Refers to total income from all transfer payments received from federal, provincial or municipal governments. Includes such benefits as Canada Pension Plan, Unemployment Insurance, Child Tax Benefit etc. nUrban nRural
Unemployment Rate for Ages 15 and over in 2011 (Source: Statistics Canada, National Household Survey, 2011, Census Subdivision Data) Ontario: 6.1% Urban: 6.3% Western CFDC: 8%
Unemployment Rate for Ages 15 and over in 2011 (Source: Statistics Canada, National Household Survey, 2011, Census Subdivision Data) nUrban nRural
Unemployment Rates by Gender (15 and over) in 2011 (Source: Statistics Canada, National Household Survey, 2011, Census Subdivision Data)
Employment Occupations in WOCFDC Employment Growth/Decline for Agriculture Sector (Source: Statistics Canada, National Household Survey, 2011, Census Subdivision Data)
Top 3 Employment Occupations in WOCFDCA Employment Growth/Decline for Sales & Service Occupations 2006-2011 (Source: Statistics Canada, National Household Survey, 2011, Census Subdivision Data)
Top 3 Employment Occupations in WOCFDCA Employment Growth/Decline for Trades, Transportation & Equipment Operators 2006-2011 (Source: Statistics Canada, National Household Survey, 2011, Census Subdivision Data)
Top 3 Employment Occupations in WOCFDCA Employment Growth/Decline for Business, Finance & Administration 2006-2011 (Source: Statistics Canada, National Household Survey, 2011, Census Subdivision Data)
Top 3 Industries in WOCFDCA Industry Growth/Decline for Manufacturing 2006-2011 (Source: Statistics Canada, National Household Survey, 2011, Census Subdivision Data)
Top 3 Industries in WOCFDCA Industry Growth/Decline in Retail 2006-2011 (Source: Statistics Canada, National Household Survey, 2011, Census Subdivision Data)
Top 3 Industries in WOCFDCA Industry Growth/Decline in Health Care & Social Services 2006-2011 (Source: Statistics Canada, National Household Survey, 2011, Census Subdivision Data)
Places of Work for persons over the age of 15, 2011 (Source: Statistics Canada, National Household Survey, 2011, Census Subdivision Data)
Places of Work for females over the age of 15, 2011 (Source: Statistics Canada, National Household Survey, 2011, Census Subdivision Data)
Places of Work for males over the age of 15, 2011 (Source: Statistics Canada, National Household Survey, 2011, Census Subdivision Data)
Means of Transportation to Work, 2011 (Source: Statistics Canada, National Household Survey, 2011, Census Subdivision Data)
Means of Transportation to Work (Females), 2011 (Source: Statistics Canada, National Household Survey, 2011, Census Subdivision Data)
Means of Transportation to Work (Males), 2011 (Source: Statistics Canada, National Household Survey, 2011, Census Subdivision Data)
Immigration Population Growth/Decline, 2006-2011 (Source: Statistics Canada, National Household Survey, 2011, Census Subdivision Data)