Download

1 / 32
320 likes | 333 Views
Identify Key Information from a Graph. N-Q.1, F-IF.4, F-LE.1. Table of Contents. 4 :. 5: How Do I Interpret Visual Representations?. Learning Intention/Success Criteria.

E N D
Identify Key Information from a Graph N-Q.1, F-IF.4, F-LE.1
Table of Contents 4: 5: How Do I Interpret Visual Representations?
Learning Intention/Success Criteria LI: We are learning to get information off graphsSC: I know how to-read graphs in context-answer questions based on visual representations of data-interpret what is happening in the visual representation based on context and labels-understand how labels affect the meaning of different sections on the graph
Maximum The highest point in a graph The lowest point in a graph Minimum
Where the line crosses the x-axis X-Intercept The meaning will change depending on the label on the axis Where the line crosses the y-axis Y-Intercept The meaning will change depending on the label on the axis
Graph 1 The following graph shows Mehana’s distance from home on her Sunday afternoon travels as she sets out walking at noon to meet a friend.
Where was Mehana at noon? Mehana was at home
Approximately when was Mehana farthest from home? Mehana was farthest from home at 2 pm
What is the farthest Mehana traveled from home? The farthest Mehana traveled from home as 3.5 miles
How far from home was Mehana at 2:30 pm? Mehana was 2.5 miles from home
Approximately when was Mehana 1 mile from home? Mehana was 1 mile from home at 12:30 and 3:30
When did Mehana return home? Mehana returned home at 4:30
Describe what Mehana might be doing between 1:00 and 1:30 pm? Answers will vary
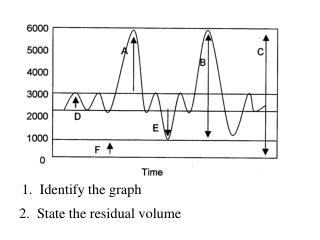
Graph 2 The following graph shows Logan’s height above the ground in feet, as he climbs a tree to get a coconut.
Where was Logan when no time had elapsed? Logan was on the ground
How high did Logan climb? Logan climbed 42 feet
When did Logan reach his maximum height? Logan reached his maximum height after 8 minutes
How many feet above the ground was Logan after 12 minutes? Logan was 18 feet above the ground
When was Logan 24 feet above the ground? Logan was 24 feet above the ground at 3 minutes and 11 minutes
When 18 minutes had passed, where was Logan? Logan was back on the ground
Describe what Logan might be doing between 4 and 6 minutes? Answers will vary
Graph 3 The following graph shows Taylor’s speed in miles/hour while driving to the store.
When did Taylor reach her maximum speed? Taylor reached her maximum speed after 4 minutes
What was Taylor’s maximum speed? Taylor’s maximum speed was 35 mph
How fast was Taylor driving 5 minutes into her trip? Taylor was driving 25 mph
When was Taylor traveling at 10 mph? Taylor was traveling at 10 mph at 1 minute and 7 minutes
When did Taylor stop? Taylor stopped at 9 minutes
Describe what Taylor might be doing between 2 and 3 minutes. Answers will vary
Reflection 1 In Graph #1, the highest point (2, 3.5) tells us that it took Mehana ________ hours to walk ________ miles from home. In Graph #2, the highest point (8, 42) tells us that it took Logan ________ minutes to climb to a height of ________ feet above the ground. In Graph #3, the highest point (4, 35) tells us that it took Taylor ________ minutes to reach a speed of ________ miles per hour 2 3.5 8 42 4 35
Reflection #2 The x-intercepts on each graph have a different meaning due to the label on the y-axis. In Graph #1, the x-intercepts tell us the times at which Mehana is _____________.In Graph #2, the x-intercepts tell us the times at which Logan is _______________.In Graph #3, the x-intercepts tell us the times at which Taylor is _______________. at home on the ground stopped
Reflection #3 The flat/horizontal sections on each graph also have a different meaning due to the label on the y-axis In Graph #1, the horizontal section tells us that Mehana is _____________________.In Graph #2, the horizontal section tells us that Logan is _______________________.In Graph #3, the horizontal section tells us that Taylor is _______________________. not moving locations not moving locations Driving at a constant speed