Download
1 / 40
400 likes | 403 Views
Access the PowerPoint presentations from the 2011 Business Outlook Summit online. Explore the change in real Louisiana GSP, population change by MSA, economic indicators, labor market, regional outlook, and threats to local economic activity.

E N D
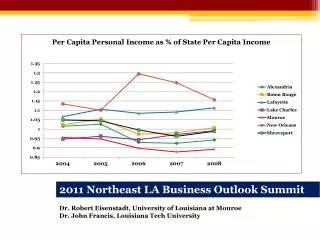
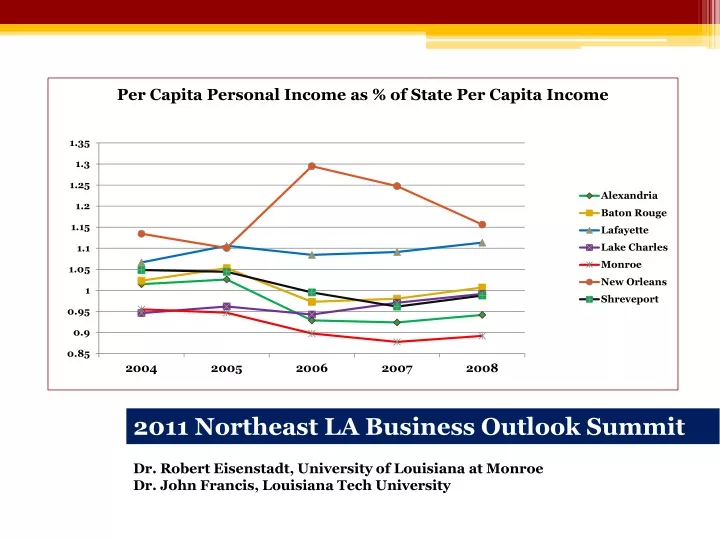
2011 Northeast LA Business Outlook Summit Dr. Robert Eisenstadt, University of Louisiana at Monroe Dr. John Francis, Louisiana Tech University
PowerPoint presentations from the 2011 BOS will be made available for review on-line at: cba.ulm.edu/cber
Population Change by MSA: 2000-2010 2000-2010 change in US = 9.7% 2000-2010 change in LA = 1.4%
Population Change in NE Louisiana: 2000-2010 Ouachita/Lincoln Parish: +10,696 NELA less Ouach/Lincoln: - 8,800
NE LA Dealer Sample: New Vehicles: Source: Cross-Sell Reports
Building Permit Value: Source: U.S. Census
2008-10 Change in Existing Home Prices: Top 5 States Northeast LA = +3.2% United States = -12.7% Source: National Association of Realtors
% Change in Median Home Prices: Louisiana MSA’s: Source: National Association of Realtors
Existing Home Sales in Lincoln, Morehouse, Ouachita, Union seem to lack support for a significant price rise… Source: NE LA Board of Realtors MLS
Ouachita foreclosures are down (approx ½ US rate): And bankruptcy filings in LA lag the Nation: 2007 = 1.0 • Western District 2010 =12,536 (+5.1%) • Louisiana 2010 = 19,236 (+5.3%) • U.S (+13.8%) Source: U.S. Federal Court
Total Covered Employment (Jobs): Figures as of 2nd qtr 2010: LA Dept of Labor; USBLS.
Health Care & Social Assistance: *US data contains both education and health care
Unemployment by MSA: US 12/2010=9.1% LA 12/2010=7.2% Source: Laworks.net
Louisiana Employment: LA continued weekly unemployment claims 2009-10 = -24.2% US continued weekly unemployment claims 2009-10 = -20.5%
Probable s sources of significant Job growth in Northeast Louisiana for the next 2-5 years: • Manufacturing • Autos • Food processing • Telecommunications • Financial Services/Information
5 year estimates of growth (range): • Jobs (f/t equivalent): 2,700 - 9,000 • 2.5% - 8.2% • HH Income($ millions): $90.0 - $285.0 • 2.4% - 7.5% % change based on aggregate of Lincoln, Morehouse, Ouachita, Richland, Union Parishes
Threats to local economic activity: • Next Auto fails to obtain Federal Loan • Cuts to State Government • Higher Education • Amounts unknown • K-12 education • Probably not
Regarding the effect on NELA of State funding cuts to higher education, consider first the annual impact of Gardner Denver Thomas:
Now consider the combined impact of ULM, Tech, and Grambling on NELA. And a 5% cut in State funding: Source of data: Louisiana Board of Regents
Thank you for Supporting the Tech/ULM Business Outlook Summit. ?’s