Download
1 / 93
930 likes | 936 Views
Storage: Demands and Alternate Futures. Yotta Zetta Exa Peta Tera Giga Mega Kilo. Jim Gray Microsoft Research Research.Microsoft.com/~Gray/talks. Acknowledgments: Thank You!!. EOS/DIS Alt Architecture: Stonebraker, Moore,… Tom Barclay & Don Slutz: Microsoft TerraServer

E N D
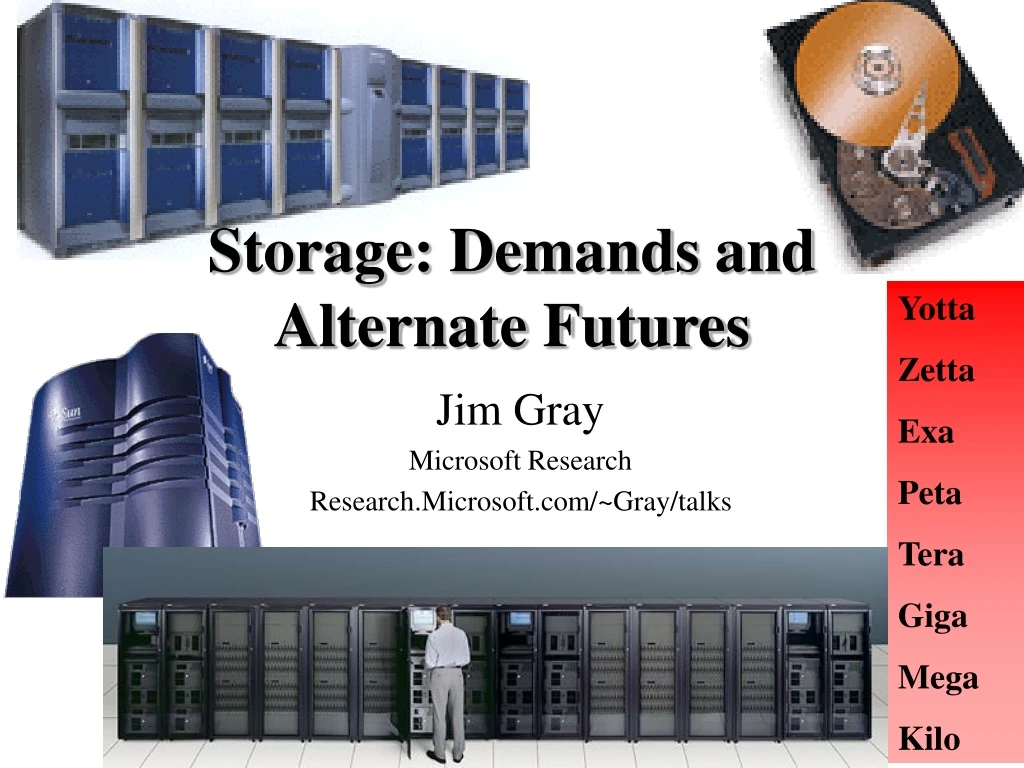
Storage: Demands and Alternate Futures Yotta Zetta Exa Peta Tera Giga Mega Kilo Jim Gray Microsoft Research Research.Microsoft.com/~Gray/talks
Acknowledgments: Thank You!! • EOS/DIS Alt Architecture: Stonebraker, Moore,… • Tom Barclay & Don Slutz: Microsoft TerraServer • Alex Szalay (Johns Hopkins): SDSS description • Dave Patterson (UCB): Convinced me that processors are moving to the devices. • Kim Keeton and Erik Riedell • Showed that many useful subtasks can be done by disk-processors, and quantified execution interval • Remzi Dusseau: Re-validated Amdahl’s laws
Outline • Interesting Apps • The Surprise-Free Future (5 years) • 500 mips cpus for 10$ • 1 Gb RAM chips • MAD at 50 Gbpsi • 10 GBps SANs are ubiquitous • 1 GBps WANs are ubiquitous • Some consequences • Absurd (?) consequences. • Auto-manage storage • Raid10 replaces Raid5 • Disc-packs • Disk is the archive media of choice • A surprising future? • Disks (and other useful things) become supercomputers. • Apps run “in the disk”
Interesting Apps • EOS/DIS • TerraServer • Sloan Digital Sky Survey Kilo 103 Mega 106 Giga 109 Tera 1012 today, we are here Peta 1015 Exa 1018
The Challenge -- EOS/DIS • Antarctica is melting -- 77% of fresh water liberated • sea level rises 70 meters • Chico & Memphis are beach-front property • New York, Washington, SF, LA, London, Paris • Let’s study it! Mission to Planet Earth • EOS: Earth Observing System (17B$ => 10B$) • 50 instruments on 10 satellites 1999-2003 • Landsat (added later) • EOS DIS: Data Information System: • 3-5 MB/s raw, 30-50 MB/s processed. • 4 TB/day, • 15 PB by year 2007
The Process Flow • Data arrives and is pre-processed. • instrument data is calibrated, gridded averaged • Geophysical data is derived • Users ask for stored data OR to analyze and combine data. • Can make the pull-push split dynamically Push Processing Pull Processing OtherData
Designing EOS/DIS • Expect that millions will use the system (online)Three user categories: • NASA 500 -- funded by NASA to do science • Global Change 10 k - other earth scientists • Internet 200 m - everyone else Grain speculators Environmental Impact Reports New applications => discovery & access must be automatic • Allow anyone to set up a peer- node (DAAC & SCF) • Design for Ad Hoc queries, Not Standard Data Products If push is 90%, then 10% of data is read (on average). => A failure: no one uses the data, in DSS, push is 1% or less. => computation demand is enormous(pull:push is 100: 1)
The Architecture • 2+N data center design • Scaleable OR-DBMS • Emphasize Pull vs Push processing • Storage hierarchy • Data Pump • Just in time acquisition
Obvious Point: EOS/DIS will be a cluster of SMPs • It needs 16 PB storage • = 1 M disks in current technology • = 500K tapes in current technology • It needs 100 TeraOps of processing • = 1K processors (current technology) • and ~ 100 Terabytes of DRAM • 1999 requirements are 10x smaller • smaller data rate • almost no re-processing work
2+N data center design • duplex the archive (for fault tolerance) • let anyone build an extract (the +N) • Partition data by time and by space (store 2 or 4 ways). • Each partition is a free-standing OR-DBBMS (similar to Tandem, Teradata designs). • Clients and Partitions interact via standard protocols • OLE-DB, DCOM/CORBA, HTTP,…
Hardware Architecture • 2 Huge Data Centers • Each has 50 to 1,000 nodes in a cluster • Each node has about 25…250 TB of storage • SMP .5Bips to 50 Bips 20K$… • DRAM 50GB to 1 TB 50K$… • 100 disks 2.3 TB to 230 TB 100K$… • 10 tape robots 25 TB to 250 TB 100K$ • 2 Interconnects 1GBps to 100 GBps 20K$ • Node costs 300K$ • Data Center costs 15M$ (capital cost)
Scaleable DBMS • Adopt cluster approach (Tandem, Teradata, VMScluster,..) • System must scale to many processors, disks, links • OR DBMS based on standard object model • DB2, SQL/MX, Informix, Oracle,…. • Grow by adding components • System must be self-managing
10-TB RAM 500 nodes 1 PB of Disk 30,000 drives 15 PB of Tape Robot 4x300 robots Storage Hierarchy • Cache hot 10% (1.5 PB) on disk. • Keep cold 90% on near-line tape. • Remember recent results on speculation • (more on this later Kaps/Maps/SCANS)
Data Pump • Some queries require reading ALL the data (for reprocessing) • Each Data Center scans the data every 2 weeks. • Data rate 10 PB/day = 10 TB/node/day = 120 MB/s • Compute on demand small jobs • less than 1,000 tape mounts • less than 100 M disk accesses • less than 100 TeraOps. • (less than 30 minute response time) • For BIG JOBS scan entire 15PB database • Queries (and extracts) “snoop” this data pump.
Problems • HSM • Design and Meta-data • Ingest • Data discovery, search, and analysis • reorg-reprocess • disaster recovery • cost
What this system teaches us • Traditional storage metrics • KAPS: KB objects accessed per second • $/GB: Storage cost • New metrics: • MAPS: megabyte objects accessed per second • SCANS: Time to scan the archive • Admin cost (!!) • Auto parallelism
SMP Super Server Departmental Server Personal System Scale Up and Scale Out Grow Up with SMP 4xP6 is now standard Grow Out with Cluster Cluster has inexpensive parts Cluster of PCs
Microsoft TerraServer: Scaleup to Big Databaseshttp://TerraServer.Microsoft.com/ • Build a multi-TB SQL Server database • Data must be • 1 TB • Unencumbered • Interesting to everyone everywhere • And not offensive to anyone anywhere • Loaded • 1.5 M place names from Encarta World Atlas • 4 M Sq Km from USGS (1 meter resolution) • 1 M Sq Km from Russian Space agency (2 m) • On the web (world’s largest atlas) • Sell images with commerce server.
Earth is 500 Tera-meters square USA is 10 tm2 100 TM2 land in 70ºN to 70ºS We have pictures of 6% of it 3 tsm from USGS 2 tsm from Russian Space Agency Compress 5:1 (JPEG) to 1.5 TB. Slice into 10 KB chunks Store chunks in DB Navigate with Encarta™ Atlas globe gazetteer StreetsPlus™ in the USA Someday multi-spectral image of everywhere once a day / hour .2x.2 km2 tile .4x.4 km2 image .8x.8 km2 image 1.6x1.6 km2 image Microsoft TerraServer Background
US Geologic Survey 4 Tera Bytes Most data not yet published Based on a CRADA Microsoft TerraServer makes data available. 1x1 meter 4 TB Continental US New DataComing USGS “DOQ” USGS Digital Ortho Quads (DOQ)
SPIN-2 Russian Space Agency(SovInfomSputnik)SPIN-2 (Aerial Images is Worldwide Distributor) • 1.5 Meter Geo Rectified imagery of (almost) anywhere • Almost equal-area projection • De-classified satellite photos (from 200 KM), • More data coming (1 m) • Selling imagery on Internet. • Putting 2 tm2 onto Microsoft TerraServer.
Microsoft BackOffice SPIN-2 Demo http://www.TerraServer.Microsoft.com/
Hardware DS3 SPIN-2 Map Site Server Internet Servers 100 Mbps Ethernet Switch Web Servers 1TB Database Server AlphaServer 8400 4x400. 10 GB RAM 324 StorageWorks disks 10 drive tape library (STC Timber Wolf DLT7000 )
Software TerraServer Web Site Web Client ImageServer Active Server Pages Internet InformationServer 4.0 HTML JavaViewer The Internet browser MTS Terra-ServerStored Procedures Internet InfoServer 4.0 Internet InformationServer 4.0 SQL Server 7 MicrosoftSite Server EE Microsoft AutomapActiveX Server Automap Server Image DeliveryApplication SQL Server7 TerraServer DB Image Provider Site(s)
System Management & Maintenance • Backup and Recovery • STK 9710 Tape robot • Legato NetWorker™ • SQL Server 7 Backup & Restore • Clocked at 80 MBps (peak)(~ 200 GB/hr) • SQL Server Enterprise Mgr • DBA Maintenance • SQL Performance Monitor
DLTTape “tar” \Drop’N’ LoadMgrDB DoJob Wait 4 Load DLTTape NTBackup ESA ... LoadMgr Cutting Machines LoadMgr AlphaServer4100 AlphaServer4100 60 4.3 GB Drives 10: ImgCutter 20: Partition 30: ThumbImg40: BrowseImg 45: JumpImg 50: TileImg 55: Meta Data 60: Tile Meta 70: Img Meta 80: Update Place ImgCutter 100mbitEtherSwitch \Drop’N’ \Images TerraServer Enterprise Storage Array STCDLTTape Library AlphaServer8400 108 9.1 GB Drives 108 9.1 GB Drives 108 9.1 GB Drives BAD OLD Load
Staging Disk JPEG tiles DLTTape “tar” Metadata Load DB Active Server Pages Cut & Load Scheduling System Image Cutter Merge ODBC Tx TerraLoader ODBC TX TerraServer SQLDBMS Dither Image Pyramid From base ODBC Tx New Image Load and Update
Other Details • Active Server pages • faster and easier than DB stored procedures. • Commerce Server is interesting • Images the Inventory • no SKU, • millions of them • USGS built their own • they are very smart, but it is easy • masquerade as a credit-card reader. • The earth is a geoid, and • Every Geographer has a coordinate system (or two). • Tapes are still a nightmare. • Everyone is a UI expert.
TerraServer Daily Traffic Jun 22, 1998 thru June 22, 1999 30M Sessions 20M Hit Count Page View DB Query Image 10M 0 6/22/98 7/22/98 8/22/98 9/22/98 1/22/99 2/22/99 3/22/99 4/22/99 5/22/99 6/22/99 10/22/98 11/22/98 12/22/98 After a Year: • 1 TB of data750 M records • 2.3 billion Hits • 2.0 billion DB Queries • 1.7 billion Images sent • 368 million Page Views • 99.93% DB Availability • 3rd design now Online • Built and operated by team of 4 people
TerraServer What Next • Integrated with Encarta Online(a classic technology transfer story) • Adding USGS Topographic maps (4 TB more) • Potential European coverage (?) • Adding mult-layer maps (with UC Berkeley) • Thinking about Geo-Spatial extension to SQL Server
The Sloan Digital Sky Survey A project run by the Astrophysical Research Consortium (ARC) The University of Chicago Princeton University The Johns Hopkins University The University of Washington Fermi National Accelerator Laboratory US Naval Observatory The Japanese Participation Group The Institute for Advanced Study SLOAN Foundation, NSF, DOE, NASA Goal: To create a detailed multicolor map of the Northern Sky over 5 years, with a budget of approximately $80M Data Size: 40 TB raw, 1 TB processed
Scientific Motivation Create the ultimate map of the Universe: The Cosmic Genome Project! Study the distribution of galaxies: What is the origin of fluctuations? What is the topology of the distribution? Measure the global properties of the Universe: How much dark matter is there? Local census of the galaxy population: How did galaxies form? Find the most distant objects in the Universe: What are the highest quasar redshifts?
Cosmology Primer The Universe is expanding: the galaxies move away from us spectral lines are redshifted v = Ho r Hubble’s law The fate of the universe depends on the balance between gravity and the expansion velocity = density/criticalif <1, expand forever d> * Most of the mass in the Universe is dark matter, and it may be cold (CDM) P(k):power spectrum The spatial distribution of galaxies is correlated, due to small ripples in the early Universe.
The ‘Naught’ Problem What are the global parameters of the Universe? H0the Hubble constant 55-75 km/s/Mpc 0the density parameter 0.25-1 0 the cosmological constant 0 - 0.7 Their values are still quite uncertain today... Goal:measure these parameters with an accuracy of a few percent High Precision Cosmology!
daCosta etal 1995 SDSS Collaboration 2002 deLapparent, Geller and Huchra 1986 Gregory and Thompson 1978 The Cosmic Genome Project The SDSS will create the ultimate mapof the Universe, with much more detailthan any other measurement before
The Topology of Local Universe Measure the Topology of the Universe Does it consist of walls and voids or is it randomly distributed?
Finding the Most Distant Objects Intermediate and high redshift QSOs Multicolor selection function. Luminosity functions and spatial clustering. High redshift QSO’s (z>5).
Features of the SDSS Special 2.5m telescope, located at Apache Point, NM 3 degree field of view. Zero distortion focal plane. Two surveys in one: Photometric survey in 5 bands. Spectroscopic redshift survey. Huge CCD Mosaic 30 CCDs 2K x 2K (imaging) 22 CCDs 2K x 400 (astrometry) Two high resolution spectrographs 2 x 320 fibers, with 3 arcsec diameter. R=2000 resolution with 4096 pixels. Spectral coverage from 3900Å to 9200Å. Automated data reduction Over 70 man-years of development effort. (Fermilab + collaboration scientists) Very high data volume Expect over 40 TB of raw data. About 3 TB processed catalogs. Data made available to the public.
Apache Point Observatory Located in New Mexico, near White Sands National Monument Special 2.5m telescope 3 degree field of view Zero distortion focal plane Wind screen moved separately
The Photometric Survey Northern Galactic Cap 5 broad-band filters ( u', g', r', i', z’ ) limiting magnitudes (22.3, 23.3, 23.1, 22.3, 20.8) drift scan of 10,000 square degrees 55 sec exposure time 40 TB raw imaging data -> pipeline -> 100,000,000 galaxies 50,000,000 stars calibration to 2% at r'=19.8 only done in the best seeing (20 nights/yr) pixel size is 0.4 arcsec, astrometric precision is 60 milliarcsec Southern Galactic Cap multiple scans (> 30 times) of the same stripe Continuous data rate of 8 Mbytes/sec
Survey Strategy Overlapping 2.5 degree wide stripes Avoiding the Galactic Plane (dust) Multiple exposures on the three Southern stripes
The Spectroscopic Survey Measure redshifts of objects distance SDSS Redshift Survey: 1 million galaxies 100,000 quasars 100,000 stars Two high throughput spectrographs spectral range 3900-9200 Å. 640 spectra simultaneously. R=2000 resolution. Automated reduction of spectra Very high sampling density and completeness Objects in other catalogs also targeted
First Light Images Telescope: First light May 9th 1998 Equatorial scans
The First Stripes Camera: 5 color imaging of >100 square degrees Multiple scans across the same fields Photometric limits as expected
The First Quasars Three of the four highest redshift quasars have been found in the first SDSS test data !
Other Archives Other Archives Other Archives Concept of the SDSS Archive Science Archive (products accessible to users) OperationalArchive (raw + processed data)