Download
1 / 7
70 likes | 181 Views
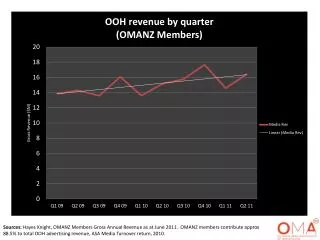
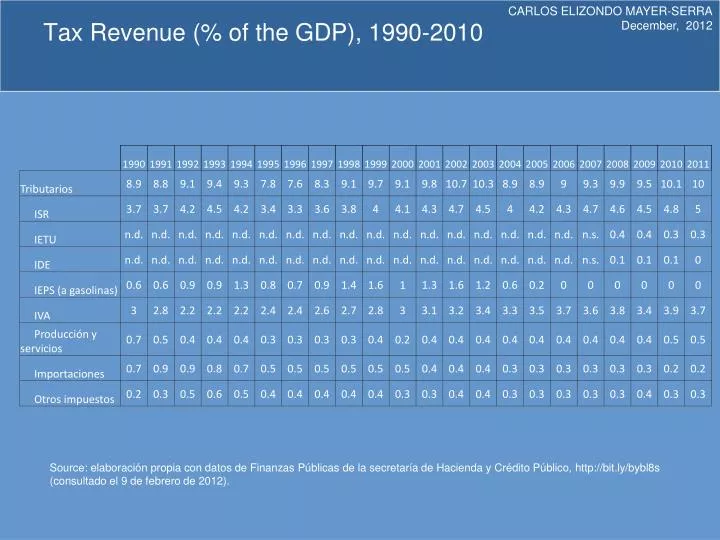
Tax Revenue (% of the GDP), 1990-2010. Source : elaboración propia con datos de Finanzas Públicas de la secretaría de Hacienda y Crédito Público, http://bit.ly/bybl8s (consultado el 9 de febrero de 2012). Tax Revenue (% of the GDP), 1990-2010.

E N D
TaxRevenue (% of the GDP), 1990-2010 Source: elaboración propia con datos de Finanzas Públicas de la secretaría de Hacienda y Crédito Público, http://bit.ly/bybl8s (consultado el 9 de febrero de 2012).
TaxRevenue (% of the GDP), 1990-2010 Source: elaboración propia con datos de Finanzas Públicas de la secretaría de Hacienda y Crédito Público, http://bit.ly/bybl8s (consultado el 9 de febrero de 2012).
Taxable Income Level (in USD) Where Highest Rates of Personal Income Tax Take Effect FirstFive LastFive Source: KPMG’s Individual Income Tax and Social Security Rate Survey 2011
OilRevenue vs. Non-oilrevenues (% of the GDP) 1990-2011 Source: elaboración propia con datos de Finanzas Públicas de la secretaría de Hacienda y Crédito Público, http://bit.ly/bybl8s (consultado el 9 de febrero de 2012).
Income, average expenditure and contribution to revenue by decile, 2010 Fuente: “distribución del pago de impuestos y recepción del gasto público por deciles de hogares y personas. Resultados para el año de 2010”, secretaría de Hacienda y Crédito Público, México, febrero de 2012, pp. 12 y 20. Disponible en http://bit.ly/PnzsVk
TaxRevenue in LatinAmerica ,2010 (% of the GDP) GiniCoefficient in LatinAmerica, 2010. Fuente: “Ingresos Tributarios en Porcentaje del PIB”, cepal, Stat, 2010. http://bit.ly/nXVBuT). Para el coeficiente de GINI: undp, Inequality-Adjusted Human DevelopmentIndex, 2010, http://bit.ly/edUig8.
Concentration ratios and public spending by program, 2010 Fuente: John Scott, “Gasto público para la equidad: del estado excluyente hacia un estado de bienestar Universal”, Programa Presupuesto y Gasto Público en México. Serie: ¿Gastamos para mejorar?, México evalúa. Centro de Análisis de Políticas Públicas, México, 2010, p. 15, http://bit.ly/fkPx21 (consultado el 11 de junio de 2012).