Download

1 / 52
520 likes | 1.01k Views
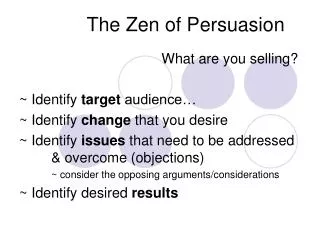
The Zen of Visual Analysis. Chris Stolte Vice President, Engineering & co-founder Jock Mackinlay Director, Visual Analysis. How do people reason about data?. The Cycle of Visual Analysis. “Wildlife Strike Database” http://wildlife-mitigation.tc.faa.gov/public_html/index.html.

E N D
The Zen of Visual Analysis Chris StolteVice President, Engineering & co-founder Jock Mackinlay Director, Visual Analysis
“Wildlife Strike Database”http://wildlife-mitigation.tc.faa.gov/public_html/index.html
How do we empowerindividuals and groups toeffectively analyze and share data?
Incremental Expressive Unified Direct
Supporting the “Cycle of Visual Analysis”: Incremental Allow people to easily and incrementally change the data and how they are looking at it click click
Supporting the “Cycle of Visual Analysis”:Expressive There is no single viewfor all tasks and all data
Supporting the “Cycle of Visual Analysis”:Unification with the database Traditional Reporting Tools versus Tableau Traditional Visualization Tools
Supporting the “Cycle of Visual Analysis”:Unification with the database Leverage the revolutionarychangesindatabase technology
Supporting the “Cycle of Visual Analysis”:Direct Interaction Make the tool disappear. Allow the user to directly interact with the data.
How is this possible? VizQL
People shouldnothave to be graphic designers orpsychologists.
Generating Effective Views of Data An effective presentation of data: • Communicates all of the data • Communicates only the data • Leverages the human perceptual system • Is understandable • Is interpretable
Generating Effective Views of Data Communicatesall of relevant data Bad Bad Good
Generating Effective Views of Data Communicatesonly the data Bad Bad
Generating Effective Views of Data Leveragesthehuman perceptual system Bad Good
Generating Effective Views of Data Isunderstandable
advice:Keepyour visualssimple
Generating Effective Views of Data Isinterpretable
advice:Annotate but remainfocused
How does Tableau support generating effective views of data? Best practices are built into the product Great defaults Show Me and Show Me Alternatives Small multiples Limiting the visual properties to a proven set Titling, captioning, and annotation Generating Effective Views of Data
Share Interactive Views • Communicate all the data • Demonstrate yourconfidence • Allow people to test your conclusions • Let your audience engage directly with the data
advice:Empoweryouraudience – • share interactive views
Share Interactive Views Underlying Aggregated
advice:Datais a dish • best served raw
Share Interactive Views • Ad hoc analysis often reveals effective patterns of analysis.
advice:Leave a trail – model effective analysis with actions.
Share Interactive Views How do I design for interaction?
Share Interactive Views Ben Shneiderman’s mantra: • “Overview first, • zoom&filter, • then details-on-demand.” Quick filters Filtering actions View underlying data Tooltips Master-detail
Share Interactive Views Jacques Bertin’s permutation matrices: Programmatic sort 1-click sort
advice:knowyour audience • and designfor • their questions
Share Interactive Views • Task: Finding an object and viewing it “in context” Wildcard filter Text lists Highlighting
Share Interactive Views • Task: Finding and understanding relationships Dashboards with multiple perspectives Highlighting
Share Interactive Views • Interaction “resiliency”:Think about how your views will change when people interact
“Wildlife Strike Database”http://wildlife-mitigation.tc.faa.gov/public_html/index.html
Who can Visual Analysis help? Anybodywith data and questions
advice:Do not limityourself to • large data or • special projects