Download
1 / 57
570 likes | 832 Views
Power System Operation. Janusz Bialek. Syllabus. Main power system characteristics Why power system looks the way it does The future power system Maintaining power balance Illustration using historic blackouts. Breakdown of electricity bill ( Ofgem , 2018). 17%, ?? in 2013.

E N D
Power System Operation Janusz Bialek
Syllabus • Main power system characteristics • Why power system looks the way it does • The future power system • Maintaining power balance • Illustration using historic blackouts
Breakdown of electricity bill (Ofgem, 2018) 17%, ?? in 2013 33% (58% in 2013) 17% (11% in 2013) 25% (20% in 2013 incl. 4% transmission)
Power System in 20th Century • Unidirectional flow of power from power stations to customers • Highly predictable and passive demand. • Limited number of large controllable power stations • Limited energy storage (pumped hydro) • Dispatch: generation follows demand • Legacy infrastructure
20th Century power system planning and control Planning target • Planning: • Infrastructure (G, T, D) planned to serve peak load + reserve • Very low utilization rates (50% generation, 30% transmission, even lower distribution) • Control: • Centralized, hierarchical • Deterministic • Preventive based on (N-1) reliability condition (not in Russia) • Very conservative - system expensive to build and operate • But very reliable!
Power System in 21st Century • Still legacy infrastructure but: • Bi-directional flow of power • Stochastic generation and demand • Large number of non-controllable stochastic power sources • Energy storage • Growth in ICT infrastructure (sensors, Internet, WAMS) enabling a change of paradigm of power system planning control
Power system planning and control in 21st Century • Control: • from preventive (N-1) to corrective (just-in-time) • from deterministic to stochastic • from centralized to distributed • Storage changes dispatch – time linkages • No longer demand-driven generation, controllable loads • Result: reduced security margins, cheaper operation • Planning: • Changes in control reduce the need for infrastructure (G, T, D) • Improved utilization rates, deferred investment • But must maintain reliability!
Future Power Market MCP2 MCP1 • Market clearing price (MCP) is set by the marginal generator • Increasing load increases prices when the marginal cost curve is increasing • Sub-marginal generators receive rents (MCP – MC) to cover their fixed costs • Will it function when the marginal cost curve is (nearly) flat? Source: PJM
Unique characteristics of the power system • Generation = demand + losses (including storage) • Power flows in the network according to the laws of physics (Ohm’s Law, Kirchhoff’s Current and Voltage Laws) • Power network is not a transportation network • Flows cannot be directly routed – a given line flow depends on generation/demand pattern in the whole system • There are no valves – network congestion may result in overheated circuits and damage • Congestion management requires coordinated redispatch
Loop flows in a meshed network • In meshed networks power does not flow directly from A to B but through all transmission lines • Only 38% of F-I trade flows directly • Loop flows via the neighbours from wind in Northern Germany • Overload the neighbours networks if dispatch is not coordinated (it isn’t) • Phase-shifting transformers (PST) – direct (partial) control of power flows
Why interconnected? • Using the cheapest energy sources wherever they are • Taking advantage of differences in living (and loading) patterns: peak-shaving • Sharing generation reserve in case a power station is suddenly lost. The larger the area the greater the saving. Assume 3 equal areas each requiring 2GW reserve when operating separately – total reserve 6 GW. Connecting them gives the total reserve (assuming that loss of generation in each area is an independent event) 42% saving Sharing reserve is the main historic reason for interconnection
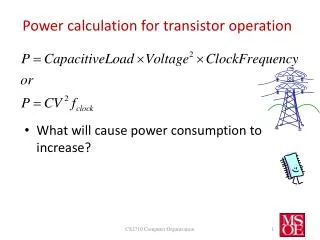
Why so many voltage levels? Transmission losses: Ploss = RI2 Power = voltage x current Increasing voltage twice reduces current twice and therefore reduces transmission losses 4 times But increasing voltage level increases the cost of insulation Transmission lines – longer distances, higher voltage (275 kV, 400 kV) Distribution lines – shorter distances, lower voltage (132 kV, 33 kV, 11 kV)
Single Phase Synchronous Machine Faraday’s Law: induced voltage = rate of change of flux end of the arrow E max direction of winding: head of the arrow A rotating magnet will induce a sinusoidal voltage in the stator’s coil.
3 Phase Machine (i.e. with 3 sets of coils located at 1200 intervals around the stator) Y B R The three windings produce three ac voltage waveforms (red, yellow and blue) shifted by 1200 in phase wrt each other
joining the return wires gives R R R Y R R Y B = Y Y Y B B B B B R Y N Three-Phase Circuit = 3 single-phase circuits with common return (neutral)
Assuming balanced loading (ZR = ZY = ZB), the return current is: IN = IR + IY + IB = I sin(t) + I sin(t + 1200) + I sin(t - 1200) = = I (sin(t) + sin(t + 1200) +sin(t - 1200) ) = 0 As the return current is zero, the wire can be removed resulting in significant savings! Three single-phase systems require 6 wires connecting the source and the load. An equivalent three-phase system requires only 3 wires so the saving is 50% on all transmission and distribution lines! In practice there is always some amount of load imbalance so a return wire is usually provided. But the return current is small so the return wire may be much thinner than the phase wires – see the photo. If the load is balanced, we use a single-circuit representation of a 3-phase circuit.
Why AC rather than DC? Distribution transformer Transmission transformer
Transformers • Faraday’s Law: Voltage induced (emf) is proportional to the rate of change of flux, E = - dΦ/dt • Transformer must be fed by ac voltage • Power electronic transformers are available but they are less efficient and cannot handle high power flows
The other reasons for AC • Induction motor: the workhorse of the industry • How to maintain a power balance without measuring all the generation and demand?
Frequency control: how to maintain a power balance (generation=demand) in an AC system? • In a time scale of minutes, the balance of power is maintained by power system operator instructing power plants to follow demand • How is an instantaneous power balance maintained when e.g. Sizewell B trips?
What happens when say Sizewell B trips? • Immediately afterwards demand exceeds generation • But the lights stay on: where does the balance come from – no time for the dispatcher to give command to increase generation? • Inertia - kinetic energy stored in rotating masses • The mass keeps rotating even if the driving force is removed • Ek = I ω2/2 where I is the moment of inertia (kg m2), ω is the rotational velocity (rad/s) and ω = 2 f (for 2-pole machines) • That kinetic energy stored in the rotating plants provides a cushion for any momentary imbalance of power • Frequency drops indicating power imbalance and triggering control • Frequency is a universal power imbalance – the same everywhere in the system
Primary frequency control: restoring power balance after a large plant drops off • Stage 1 - inertial response: • power deficit is covered from inertia (kinetic energy) of all synchronous generators • If nothing else happens, frequency will keep dropping • Stage 2 – reaction by Turbine Governors: • frequency drop is sensed by Turbine Governors • Turbine Governors open more the turbine valves hence releasing more steam/water (increasing power output) • This activates adjustment of the steam generation process (in a thermal plant) • Increasing output power continues until power balance is restored: frequency drop is halted but it is less than 50 Hz • steady-state error typical for proportional (P) control
Primary frequency control • Primary frequency control is fully automatic – all generators must be equipped with Turbine Governors with a droop characteristic • Power stations have to operate derated to provide a headroom (frequency reserve) speed Actual output power
Frequency trace following a large infeed loss Initial slope of decline is determined by system inertia (or cumulative inertial response of all generators) Increased output due to action of Turbine Governors Frequency drop halted but at a lower level Restoring power balance Primary frequency control is fully autonomous and decentralised (turbine governors installed on all generators) Primary Frequency Control
Secondary frequency control: restoring the nominal frequency • Frequency is still less than 50 Hz • System Operator instructs power stations to increase generation and restore 50 Hz • Manual in GB: National Grid instructs most economic and flexible power stations to increase output • Automatic in Europe/USA: Automatic Generation Control – AGC. The required generation increase is allocated to individual power stations by a central controller – usually PI type. • Differences between primary and secondary frequency control • Primary: fully autonomous and all power stations contribute according to their droop characteristics • Secondary: only some (most economic and flexible) power stations contribute as directed by a central controller
Frequency trace following a large infeed loss Initial slope of decline is determined by system inertia (or cumulative inertial response of all generators) Increased output due to action of Turbine Governors Initial frequency restored Frequency drop halted Restoring power balance Restoring 50 Hz Primary Freq. Control Secondary Freq. Control Fully autonomous, decentralised Centralised, manual or automatic
Frequency is a system-wide power balance indicator No need for telecommunication – frequency can be measured anywhere Another big advantage of AC power system: frequency provides a power balance signal the controllers can act upon. How would you do it in a large DC system? Load-frequency mechanism works only in AC system: DC links separate the systems (see GB-France) AC interconnected system is the largest machine ever built (US National Academy of Engineering, 2003)
The bigger the system, the higher inertia and smaller frequency excursions Example of large frequency variations in a small system: Ireland, August 5th 2005 Large power systems experience smaller frequency excursions
The effect of reduced inertia due to renewable penetration EirGrid, SONI: “All Island TSO Facilitation of Renewables Studies”. www.eirgrid.com A limit on the amount of instantaneous wind generation+imports Remedies: synthetic inertia, market for inertial response
Electricity Demand – TV Pickup Royal wedding 29th April 2011 • Detailed Demand & Frequency Overview 32
Max @11:44 3000MWincrease indemand Totality 2200MW dropin demand End of theeclipse Start of the eclipse Min @11:15 Demand may also rapidly decrease:effect of the total solar eclipse on National Grid demand11th August 1999 36500 Tue 10/08/1999 Wed 11/08/1999 36000 35500 35000 Demand MW 34500 34000 33500 33000 09:50 09:00 09:10 09:20 09:30 09:40 10:00 10:10 10:20 10:30 10:40 10:50 11:00 11:10 11:20 11:30 11:40 11:50 12:00 12:10 12:20 12:30 12:40 12:50 13:00 Time
TV pick-ups happen every day: demand curve for Britain's Got Talent final 05/06/2010
Earth Hour (World Wildlife Fund), 26 March 2011 Earth Hour Danger of a “frequency collapse” if a frequency drop is too deep Luckily, no accelerated fall in demand at 8.30 pm or pick-up at 9.30 pm Just as well!
What happens when there is not enough spinning reserve to cover an unexpectedly high loss of generation? • Power system security is maintained by keeping spinning reserve (i.e. not loading all the generators up to the maximum) should a power plant be unexpectedly lost • (N-1 contingency) • The normal reserve is the loss of the largest infeed (a nuclear reactor of 1320 MW at Sizewell B) • Keeping a larger reserve (N-2) is costly while it is highly unlikely that 2 or more units will be lost simultaneously • … but “unlikely” does not mean impossible • How to stop a declining frequency (i.e. prevent frequency collapse) when there is not enough generation reserve to restore a power balance?
Frequency • Two plants were lost. The total loss 1582 MW > 1320 MW planned • The resulting frequency drop caused further loss of wind generation • National Grid reduced voltage to reduce demand by 1200 MW (P = V2 /R for resistive loads) • Automatic load shedding of 581 MW (580,000 customers), triggered by a frequency drop to below 48.8 Hz, restored the generation/demand balance • More generation was connected and the supply was restored within 1 hour
Dangers of interconnection: blackouts caused by transmission faults • When a line trips, power flows redistribute almost instantaneously potentially leading to a cascading blackout • That’s why (N-1) reliability criterion – power system must be secure not only for the assumed operating conditions but also when “something” happens (so-called a credible event) • UK system is plannedto (N-D) standard • Urban networks often operate to (N-2) standard • Blackouts happen usually due to (N-2) (or more) events – but (-2) is not always a network fault
Where it all began: Ohio and surrounding areas (USA and Canada) Source: US/Canada Power System Outage Force
How it all started: a tree flashover at 3.05 pm Source: US/Canada Power System Outage Force
Is (N-1) criterion good enough? • Blackouts are always due to a combination of unusual factors • Midwest ISO (MISO) state estimator was off-line during most of the afternoon • Alarm and logging system in FirstEnergy (FE) control room failed 1 hour before the cascade started • Not only it failed, but control room engineers did not know about it • Unknown unknowns: they were blind but they did not know about that they were blind • No real-time information sharing and collaboration between TSOs
Three 345 kV lines trip between 3.05 and 3.41 Source: NERC
Effect of a line trip: increased loading on other lines potentially leading to a cascade Source: US/Canada Power System Outage Force
Effect of a line trip: depressed voltage Source: US/Canada Power System Outage Force
Speed of cascading Source: US/Canada Power System Outage Force
Dangers of interconnection: Europe 2006 bb The Times, 6 Nov 2006