Download
1 / 26
260 likes | 401 Views
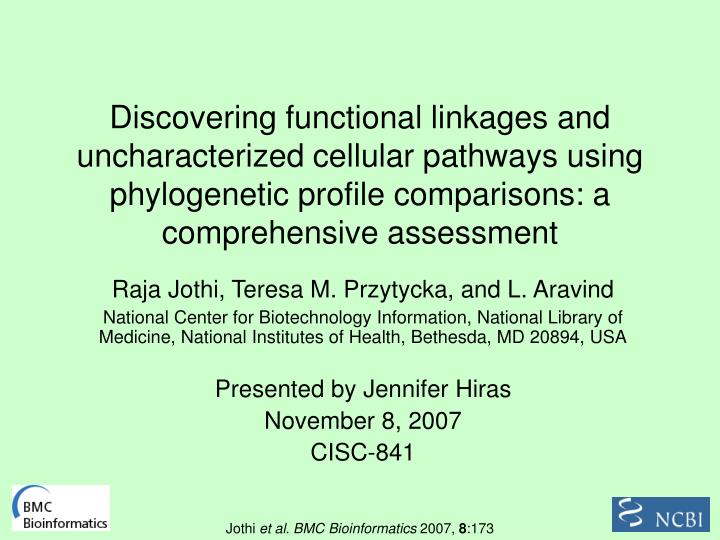
Discovering functional linkages and uncharacterized cellular pathways using phylogenetic profile comparisons: a comprehensive assessment. Raja Jothi, Teresa M. Przytycka, and L. Aravind

E N D
Discovering functional linkages and uncharacterized cellular pathways using phylogenetic profile comparisons: a comprehensive assessment Raja Jothi, Teresa M. Przytycka, and L. Aravind National Center for Biotechnology Information, National Library of Medicine, National Institutes of Health, Bethesda, MD 20894, USA Presented by Jennifer Hiras November 8, 2007 CISC-841 Jothi et al. BMC Bioinformatics 2007, 8:173
Outline • Background • Significance • Phylogenetic Profile Comparisons • Goals • Methods and Results • Data Set Construction • Phylogenetic Profile Construction • Assessing the Degree of Similarity Between Two Profiles • Pathway Similarity Calculation • Performance Measure Calculations • Statistical Significance Test • Conclusions
Background • Whole-genome sequencing has generated large amounts of genomic sequences • Major Challenges • Discovering function of proteins • Determine how proteins interact with each other in cellular pathways and networks • Phylogenetic Profile Comparisons (PPCs) • Widely used approach • Patterns of presence or absence of protein families across multiple genomes used to infer functional linkages between proteins
What is a Phylogenetic Profile? A phylogenetic profile is the description of the presence or absence of a given protein in a set of genomes Profiles of proteins B and C are similar, whereas profile of protein A is different. A profile is constructed using the BLAST similarity (E-value) score of the highest scoring sequence from a given genome http://bioinformatics.icmb.utexas.edu/plex/help.html#plex1
Phylogenetic Profile Comparisons • Proteins having matching or similar profiles are inferred to be functionally linked • Predict the function of uncharacterized proteins by simply relating profiles of proteins with known function to proteins with unknown functions • Clustering protein profiles based on their similarity
Purpose of Investigation • Goal • Measure the accuracy and coverage of PPC • Identify its biases, strengths, and weaknesses • Studied E. coli and S. cerevisiae (yeast) proteins through comparative analysis of ~900,000 known proteins from 95 different organisms • Designed 16 reference sets of genomes (Table 1) • The choice of reference set of genomes affects the predictive power of the PPC approach
Functional Linkages • KEGG pathway maps for functional linkages • to enable fair comparison of this work to previous studies that used KEGG for analysis • KEGG is one of the most widely used database for verifying large-scale functional linkage predictions • Degree of similarity between two profiles measured by mutual info score between profiles • Functionally related if mutual info score is above a certain threshold • Considered two proteins to be related (linked) if they co-occur in at least one KEGG pathway
Methods Data Set Construction • AA sequences of 894,522 proteins from 95 different organisms • 41 Bacteria, 11 Archaea, and 43 Eukaryotes • NCBI, Ensembl, BROAD, WashU, PlasmoDB, and dictyBase • NCBI's Basic Local Alignment Search Tool (BLAST) • For comparison of protein sequences against each other
Methods Phylogenetic Profile Construction • Every protein i is searched against the set of proteins from each organism j, and the presence/absence of the query protein's homolog in organism j is recorded in the form of BLAST e-value Eij. • For each protein i, a phylogenetic vector/profile P was generated with each entry Pij = -1/logEij in the vector corresponding to presence/absence information of i's homolog in organism j.
Reference sets of organisms. The relationships and divergence times (Mya) of 95 organisms (41 bacterial, 11 archaeal, and 43 eukaryotic genomes) are based on recent studies. The tree branch lengths are not proportional to time. Figure 1
Methods Assessing the Degree of Similarity Between Two Profiles Used the mutual information (MI) measure MI(A, B) = H(A) + H(B) - H(A, B) where is the entropy of profile A, and is the joint entropy of profiles A and B p(a) is the frequency with which the value a is observed in profile vector A, and p(a, b) is the frequency with which the pair of values (a, b) are observed in A and B (with a and b appearing in A and B, respectively)
Methods Pathway Similarity Calculation • KEGG pathway database used to compile the pathway membership information for each protein • Pathway similarity between two proteins A and B, calculated by taking the Jaccard coefficient of their KEGG database pathway annotation: Pathway similarity (A, B) = 100 × (| KEGGA⋂ KEGGB|)/(| KEGGA⋃ KEGGB|) where KEGGx is the set of specific pathways protein A is known to participate, and |KEGGx| is the number of unique pathways in the set. • A pathway similarity score of s between proteins A and B indicates that A is present in at least s% of the pathways that B is present in, and vice-versa.
Methods Performance Measure Calculations • Assess the performance of PPCs for prediction of functional linkages • Two proteins are considered to be functionally related (positive) if they co-occur in at least one KEGG pathway, and unrelated (negative) otherwise • Sensitivity = TP/(TP+FN) • Specificity = TN/(TN+FP) • Positive Predictive Value = TP/(TP+FP)
Results Figure 2: E. coli proteins Figure 3: Yeast proteins BAE3a
Structure and evolutionary history of individual pathways influence performance of PPCs • A KEGG pathway is an ensemble of many smaller pathways • Different pathways differ in terms of the conservation patterns of their components • Evaluated the role of diversity in conservation across different functional systems • Set of nine systems (second level of KEGG orthology) • each with 80 or more protein components • Repeated the same analysis for proteins in each of these KEGG pathways (7 of the 16 reference sets) • Analysis on individual pathways • Positive if they co-occur in the pathway under consideration. Otherwise, the pair was negative • Different from overall analysis
Translation apparatus is the most conserved pathway Most non-redundant set (NR-8) performed best, not BAE3a Phyletic pattern from diverse and NR genomes captures all useful evolutionary info necessary for functional linkage In E. coli, 5 of 8 KEGG pathways, set B best Indicates nature of conservation has effect on performance Figure 5: E. coli
Methods Statistical Significance Test • t-test to determine whether the difference in mean values of two distributions is statistically significant • The higher the t-score, the higher the significance
Differences in mean values for all 16 reference sets of genomes are statistically significant t-scores spanned a wide range Suggests dramatic differences in the performance of individual reference sets Results Figure 4: t-tests
Conclusion General Observations • Examined ~710,000 possible functional linkages in E. coli and ~640,000 in yeast • Overall performances using all 16 reference sets of genomes are depicted in Figures 2 and 3 • Predictive power of PPC approach was greatly influenced by the selection of reference set of genomes
Conclusion Selection of reference set genomes at the super-kingdom level is crucial • Reference sets composed of genomes from individual super-kingdoms (B or A) • Performs worse only the bacterial and archaeal super-kingdom (BA) • Suggests that phyletic patterns of proteins in bacterial and archaeal genomes alone provide sufficient information for reasonably accurate functional linkage predictions • Any further improvements to this performance require additions of a few eukaryotic genomes
Conclusion Selection of reference set genomes at the super-kingdom level is crucial (con’t) • Best performance - set BAE3a • contained all B and A genomes included in set and a single representative from each of the major eukaryotic lineages • Further additions of eukaryotic genomes • little or no effect on the performance in E. coli • reduced the performance in yeast
Conclusion Genome choice within the super-kingdom is a notable determinant of PPC performance • Numerous parasitic or pathogenic representatives amongst currently available E and B genomes • Lack many metabolic pathways • Sequencing efforts to date biased towards parasitic or pathogenic organisms • Resulted in over-representation in the public databases • Evaluated the effects of their inclusion on the performance of the PPC approach • Inclusion or non-inclusion of these genomes in the reference set didn’t significantly alter the performance
Conclusion Guidelines for selecting genomes for a reference set • Representatives from all 3 kingdoms of life are a must for highly accurate predictions • reasonably good accuracy can be achieved using prokaryotes alone • Specifically choose genomes representing the entire phylogenetic diversity of life. • Fully-sequenced large genomes of free-living organisms give the best info • Parasitic organisms, strains of the same species and very closely related species are unlikely to provide new predictive information