Download
1 / 1

E N D
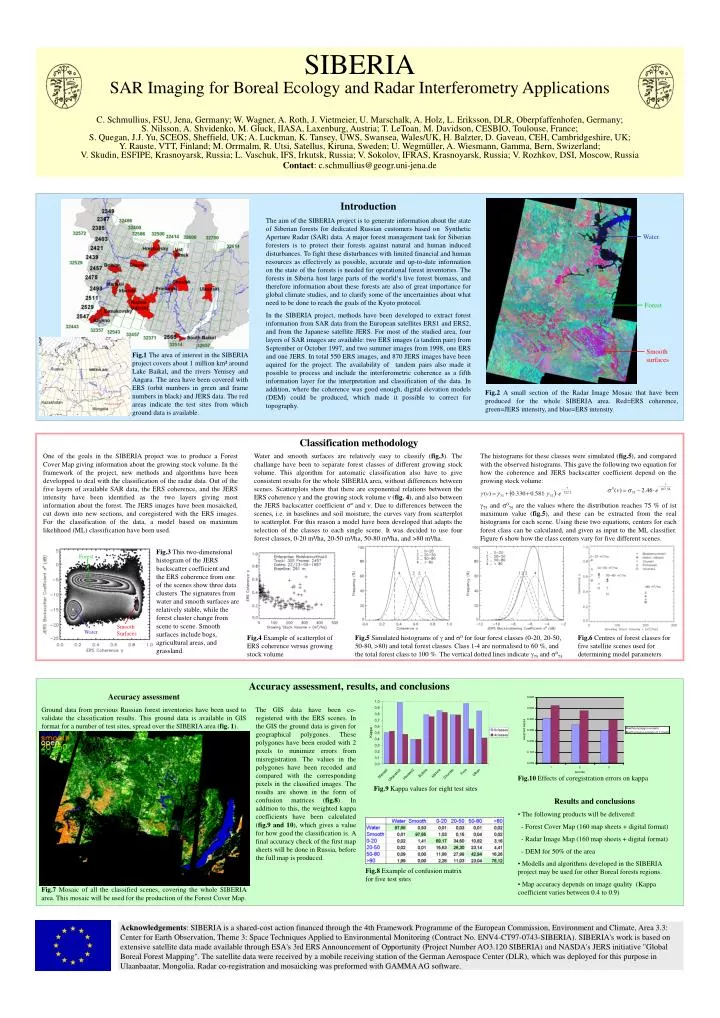
SIBERIASAR Imaging for Boreal Ecology and Radar Interferometry ApplicationsC. Schmullius, FSU, Jena, Germany; W. Wagner, A. Roth, J. Vietmeier, U. Marschalk, A. Holz, L. Eriksson, DLR, Oberpfaffenhofen, Germany; S. Nilsson, A. Shvidenko, M. Gluck, IIASA, Laxenburg, Austria; T. LeToan, M. Davidson, CESBIO, Toulouse, France; S. Quegan, J.J. Yu, SCEOS, Sheffield, UK; A. Luckman, K. Tansey, UWS, Swansea, Wales/UK, H. Balzter, D. Gaveau, CEH, Cambridgeshire, UK; Y. Rauste, VTT, Finland; M. Orrmalm, R. Utsi, Satellus, Kiruna, Sweden; U. Wegmüller, A. Wiesmann, Gamma, Bern, Swizerland; V. Skudin, ESFIPE, Krasnoyarsk, Russia; L. Vaschuk, IFS, Irkutsk, Russia; V. Sokolov, IFRAS, Krasnoyarsk, Russia; V. Rozhkov, DSI, Moscow, Russia Contact: c.schmullius@geogr.uni-jena.de Introduction The aim of the SIBERIA project is to generate information about the state of Siberian forests for dedicated Russian customers based on Synthetic Aperture Radar (SAR) data. A major forest management task for Siberian foresters is to protect their forests against natural and human induced disturbances. To fight these disturbances with limited financial and human resources as effectively as possible, accurate and up-to-date information on the state of the forests is needed for operational forest inventories. The forests in Siberia host large parts of the world‘s live forest biomass, and therefore information about these forests are also of great importance for global climate studies, and to clarify some of the uncertainties about what need to be done to reach the goals of the Kyoto protocol. In the SIBERIA project, methods have been developed to extract forest information from SAR data from the European satellites ERS1 and ERS2, and from the Japanese satellite JERS. For most of the studied area, four layers of SAR images are available: two ERS images (a tandem pair) from September or October 1997, and two summer images from 1998, one ERS and one JERS. In total 550 ERS images, and 870 JERS images have been aquired for the project. The availability of tandem pairs also made it possible to process and include the interferometric coherence as a fifth information layer for the interpretation and classification of the data. In addition, where the coherence was good enough, digital elevation models (DEM) could be produced, which made it possible to correct for topography. Water Forest Smooth surfaces Fig.1 The area of interest in the SIBERIA project covers about 1 million km² around Lake Baikal, and the rivers Yenisey and Angara. The area have been covered with ERS (orbit numbers in green and frame numbers in black) and JERS data. The red areas indicate the test sites from which ground data is available. Fig.2 A small section of the Radar Image Mosaic that have been produced for the whole SIBERIA area. Red=ERS coherence, green=JERS intensity, and blue=ERS intensity. Classification methodology One of the goals in the SIBERIA project was to produce a Forest Cover Map giving information about the growing stock volume. In the framework of the project, new methods and algorithms have been developped to deal with the classification of the radar data. Out of the five layers of available SAR data, the ERS coherence, and the JERS intensity have been identified as the two layers giving most information about the forest. The JERS images have been mosaicked, cut down into new sections, and coregistered with the ERS images. For the classification of the data, a model based on maximum likelihood (ML) classification have been used. Water and smooth surfaces are relatively easy to classify (fig.3). The challange have been to separate forest classes of different growing stock volume. This algorithm for automatic classification also have to give consistent results for the whole SIBERIA area, without differences between scenes. Scatterplots show that there are exponential relations between the ERS coherence γ and the growing stock volume ν (fig. 4), and also between the JERS backscatter coefficient σº and ν. Due to differences between the scenes, i.e. in baselines and soil moisture, the curves vary from scatterplot to scatterplot. For this reason a model have been developed that adapts the selection of the classes to each single scene. It was decided to use four forest classes, 0-20 m³/ha, 20-50 m³/ha, 50-80 m³/ha, and >80 m³/ha. The histograms for these classes were simulated (fig.5), and compared with the observed histograms. This gave the following two equation for how the coherence and JERS backscatter coefficient depend on the growing stock volume: 75 and 075 are the values where the distribution reaches 75 % of ist maximum value (fig.5), and these can be extracted from the real histograms for each scene. Using these two equations, centers for each forest class can be calculated, and given as input to the ML classifier. Figure 6 show how the class centers vary for five different scenes. Fig.3 This two-dimensíonal histogram of the JERS backscatter coefficient and the ERS coherence from one of the scenes show three data clusters. The signatures from water and smooth surfaces are relatively stable, while the forest cluster change from scene to scene. Smooth surfaces include bogs, agricultural areas, and grassland. Forest Smooth Surfaces Water Fig.4 Example of scatterplot of ERS coherence versus growing stock volume Fig.5 Simulated histograms of and 0 for four forest classes (0-20, 20-50, 50-80, >80) and total forest classes. Class 1-4 are normalised to 60 %, and the total forest class to 100 %. The vertical dotted lines indicate 75 and 075. Fig.6 Centres of forest classes for five satellite scenes used for determining model parameters Accuracy assessment, results, and conclusions Accuracy assessment Ground data from previous Russian forest inventories have been used to validate the classification results. This ground data is available in GIS format for a number of test sites, spread over the SIBERIA area (fig. 1). The GIS data have been co-registered with the ERS scenes. In the GIS the ground data is given for geographical polygones. These polygones have been eroded with 2 pixels to minimize errors from misregistration. The values in the polygones have been recoded and compared with the corresponding pixels in the classified images. The results are shown in the form of confusion matrices (fig.8). In addition to this, the weighted kappa coefficients have been calculated (fig.9 and 10), which gives a value for how good the classification is. A final accuracy check of the first map sheets will be done in Russia, before the full map is produced. Fig.10 Effects of coregistration errors on kappa Fig.9 Kappa values for eight test sites • Results and conclusions • The following products will be delivered: • - Forest Cover Map (160 map sheets + digital format) • - Radar Image Map (160 map sheets + digital format) • - DEM for 50% of the area • Modells and algorithms developed in the SIBERIA project may be used for other Boreal forests regions. • Map accuracy depends on image quality (Kappa coefficient varies between 0.4 to 0.9) Fig.8 Example of confusion matrix for five test sites Fig.7 Mosaic of all the classified scenes, covering the whole SIBERIA area. This mosaic will be used for the production of the Forest Cover Map. Acknowledgements: SIBERIA is a shared-cost action financed through the 4th Framework Programme of the European Commission, Environment and Climate, Area 3.3: Center for Earth Observation, Theme 3: Space Techniques Applied to Environmental Monitoring (Contract No. ENV4-CT97-0743-SIBERIA). SIBERIA's work is based on extensive satellite data made available through ESA's 3rd ERS Announcement of Opportunity (Project Number AO3.120 SIBERIA) and NASDA's JERS initiative "Global Boreal Forest Mapping". The satellite data were received by a mobile receiving station of the German Aerospace Center (DLR), which was deployed for this purpose in Ulaanbaatar, Mongolia. Radar co-registration and mosaicking was preformed with GAMMA AG software.