Download
1 / 10
100 likes | 183 Views
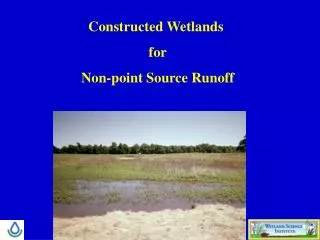
指導老師 : 褚俊傑 組員 : 葉佳霖 陳子豪 吳佳銘. Bacteria distribution and dynamics in constructed wetlands based on modelling results.

E N D
指導老師:褚俊傑 組員:葉佳霖 陳子豪 吳佳銘 Bacteria distribution anddynamics in constructed wetlands based onmodelling results
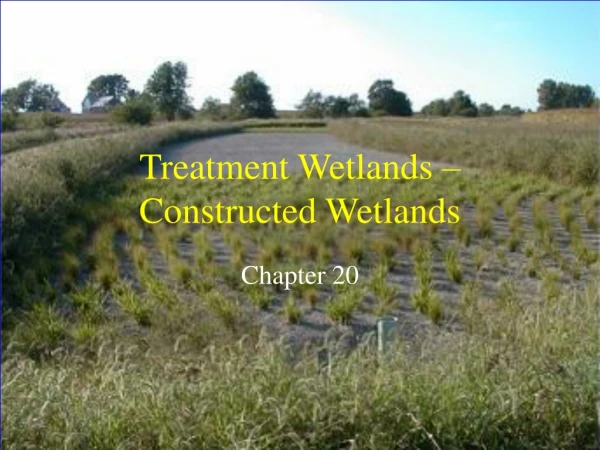
Bacteria communities growing in constructedwetlands play a major role on the removal of pollutants fromwastewaterand the presence of a stable community is a critical factor affecting their performance. With this work weaimed at finding howlong it takes for bacterial communities to stabilise in constructedwetlands and at answeringspecific questions regarding their abundance, spatial distribution and their relative importance on the treatmentprocesses. To this end the numerical model BIO_PORE was used to simulate the dynamics of 6 functional bacteriagroups (heterotrophic, autotrophic nitrifying, fermenting, acetotrophicmethanogenic,acetotrophicsulphate reducingand sulphideoxidising bacteria) within a wetland for a period of 3 years. Three indicators of bacterialstabilisationwere used: 1) total biomass; b) effluent pollutant concentrations and c) Shannon‘s diversity index. Resultsindicate that aerobic bacteria dominated the wetland until the 80th day of operation. Anaerobic bacteria dominatedthe wetland from that moment and until the end of the studied period. Bacteria stability was reachedbetween 400 and 700 days after starting operation. Once thewetland reached stability, sulphate reducing bacteriaaccounted for the highest biomass of all bacterial groups (46%). The distribution of bacterial communities obtainedafter bacterial stability is consistentwith available experimental results, andwas clearly controlled by dissolved oxygen(SO) concentrations and H2S toxicity. After stability, the progressive accumulation of inert solids pushed thelocation of the active bacteria zone towards the outlet section. Abstract
Study of bacteria dynamics and pollutants removal efficiencies To study the abundance of each bacterial group within the whole wetland we estimated the total concentration of their biomass. The actual biomass was obtained by integrating their concentration within the simulated longitudinal section (obtaining kgCOD m−1) and multiplying it by the width of the wetland (5.3 m) (obtaining kgCOD). Biomass was later normalised to a cubic meter of granular material by dividing it by the volume of the entire wetland. During simulations, the different wastewater constituents were monitored inside thewetland and in the effluent to determine pollutant removal efficiencies and also inhibition effects on different bacteria groups. Specific substrates known to cause competition between different bacteria groups were also studied in detail. To determine the removal efficiencies of N, the total influent nitrogen was considered to be the sum of ammonia, nitrite and nitrate and organic nitrogen (that contained in SF, SI, XS and XI). The N contents of each COD fraction are listed in Table 3. Methods
considers that bacteria stability is reached when no more major changes are observed in the effluent pollutant concentrations. Finally,thethird indicator considered the stabilisation of Shannon's diversityindex Where n is the total number of functional bacteria groups, Xi is the biomass of functional bacteria group i and Xtot is the sum of the biomass of all groups.Thedistribution of bacteria was studied after bacterial stabilisation,sincebefore that, it was seen to change very rapidly. Bacterial distributionwasstudied by representing the concentration of the different bacteria groups on the 2D domain.
Pollutant removal efficiencies • The system achieved its maximum COD removal efficiency after 400 days, and remained higher than 90% until the end of the three years period. From around day 80, all nitrified ammonium nitrogen was completely denitrified, and the average removal of total nitrogen from then and until the end of the three years was 30%. Bacterial assimilation was responsible for 4–10% of the removed total N and nitrification-denitrification processes accounted for 20–30% . The rest of the total N removed from inlet to outlet corresponds to accumulated organic nitrogen. Note that most of the effluent nitrogen was in the form of ammonium and ammonia. Sulphur was not removed within the system. However, a significant amount of the influent sulphate was reduced to sulphide, and the opposite process also took place. From day 110 and until the end of the simulated period, the effluent concentrations of SH2S exceeded that of SSO4, indicating intense sulphate reducing activity. Results
Percentage of the total N removed by bacterial assimilation and by nitrification denitrification processes through the 3 years period.
The low effluent COD concentrations observed in the present study are attributed to the high water temperature used in our simulation(20 °C), which boostedmicrobialactivity, and to the intense sulphate reduction observed.Infact,estimatedthe removal of organic matter by sulphate reduction to be between 47% and 79% in the same pilot wetland assumed in the present study. In another work,attributed25% of the carbon removal to the activity of sulphatereducing bacteria. However, in our simulations both sulphatereducing bacteria and sulphideoxidisingbacteria biomass might have been slightly overestimated by not considering all processes related to the sulphur cycle. In comparison,measureda 40% removal of sulphate, although in their case the proportion of sulphate reducing bacteria was also smaller. In our simulation accumulation was the main removalmechanism for N, followed by nitrification-denitrification and bacterial assimilation. Another relevant result from this study was that sulphideoxidisingbacteria was the group that most significantly contributed to denitrification, and therefore autotrophic denitrification was more important than heterotrophic denitrification. Discussion
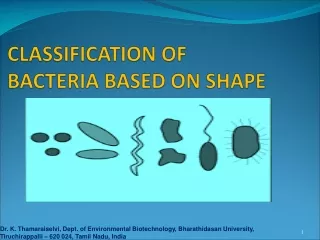
In this paper, simulation results for a period of 3 years with BIO_PORE model were presented to study bacteria dynamics and distribution in a pilot constructed wetland.Atthe start-up period heterotrophic bacteria were the first group to develop and colonise the system. After day 80 and until the end of the 3 years anaerobic bacteria groups dominated the system, being sulphate reducing bacteria the most abundant group in terms of overall biomass (47–79%) for most of the time. The high sulphatereducing activity within the wetland caused toxicity by dihydrogensulphide and delayed the growth of methanogenicbacteria. Nitrifying bacteria accounted for 1–2% of the total biomass while sulphideoxidising bacteria grew mainly under anoxic conditions and were responsible for the complete denitrification observed in the wetland.Bacterial stability was achieved between 400 and 700 days after starting operation. This time to stability is longer than the 75–100 days reported by previous experimental works, although the criteria for bacterial stabilisationis different from the ones used in this work. This paper is just a stepping stone towards the end goal of establishing a general conceptual framework of the functioning of constructed wetlands based on modelling results. Supplementary data to this article can be found online at http://dx.doi.org/10.1016/j.scitotenv.2013.04.073 Conclusions