Download
1 / 9
90 likes | 260 Views
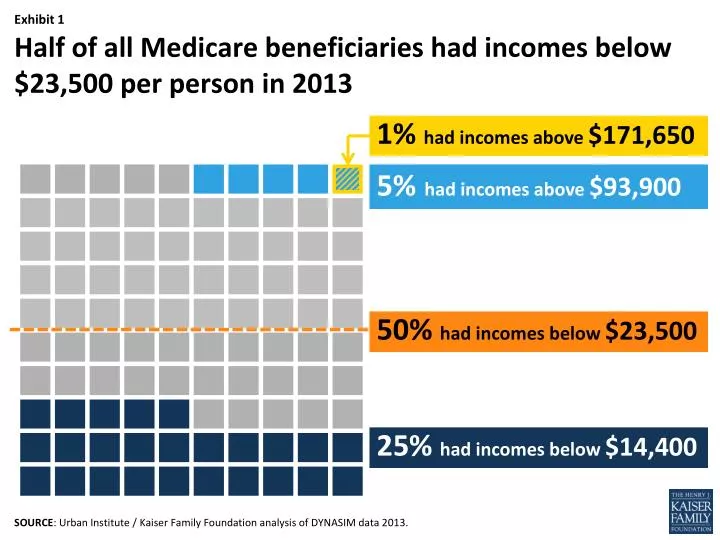
Half of all Medicare beneficiaries had incomes below $23,500 per person in 2013 . 1% had incomes above $171,650. 5% had incomes above $93,900. 50% had incomes below $23,500. 25% had incomes below $ 14,400.

E N D
Half of all Medicare beneficiaries had incomes below $23,500 per person in 2013 1% had incomes above $171,650 5%had incomes above $93,900 50% had incomes below $23,500 25% had incomes below $14,400 SOURCE: Urban Institute / Kaiser Family Foundation analysis of DYNASIM data 2013.
Median per capita income among Medicare beneficiaries varies by beneficiary characteristics in 2013 NOTE: Total household income for couples is split equally between husbands and wives to estimate income for married beneficiaries. SOURCE: Urban Institute / Kaiser Family Foundation analysis, 2013.
Growth in per capita income is projected to be concentrated among beneficiaries with higher incomes Per Capita Total Income (in 2013 dollars) 95th percentile 90th percentile 75th percentile 50th percentile (Median) 25th percentile Year NOTE: All incomes are adjusted to 2013 dollars. SOURCE: Urban Institute / Kaiser Family Foundation analysis, 2013.
Half of all Medicare beneficiaries had savings below $61,400 per person in 2013 1% had savings above $3,423,800 5% had savings above $1,112,950 50% had savings below $61,400 25% had savings below $11,300 8% had $0 in savings or were in debt SOURCE: Urban Institute / Kaiser Family Foundation analysis of DYNASIM data 2013.
Median per capita savings among Medicare beneficiaries varies by beneficiary characteristics in 2013 NOTE: Total household savings for couples is split equally between husbands and wives to estimate savings for married beneficiaries. SOURCE: Urban Institute / Kaiser Family Foundation analysis, 2013.
Growth in per capita savings is projected to be concentrated among beneficiaries with more savings Per Capita Total Savings, among all beneficiaries (in 2013 dollars) 95th percentile 90th percentile 75th percentile 50th percentile (Median) Year NOTE: All savings are adjusted to 2013 dollars. SOURCE: Urban Institute / Kaiser Family Foundation analysis, 2013.
Half of all Medicare beneficiaries had home equity below $66,700 per person in 2013 1% had home equity above $799,850 5% had home equity above $398,500 50% had home equity below $66,700 25% had home equity below $12,250 21% had $0 in home equity SOURCE: Urban Institute / Kaiser Family Foundation analysis of DYNASIM data 2013.
Median per capita home equity among Medicare beneficiaries varies by beneficiary characteristics in 2013 NOTE: Total household home equity for couples is split equally between spouses to estimate home equity for married beneficiaries. SOURCE: Urban Institute / Kaiser Family Foundation analysis, 2013.
Growth in per capita home equity is projected to be concentrated among beneficiaries with more in home equity Per Capita Home Equity, among all beneficiaries (in 2013 dollars) 95th percentile 90th percentile 75th percentile 50th percentile (Median) Year NOTE: All home equity amounts are adjusted to 2013 dollars. SOURCE: Urban Institute / Kaiser Family Foundation analysis, 2013.