Download
1 / 27
270 likes | 545 Views
Evaluating End-User Experience Management Solutions. The Performance Monitoring Landscape. Application Performance Management Frameworks IBM Tivoli; HP Open VIew Resource Monitoring Agents on Server Example: i3 and Solution Manager Application logging and tracing

E N D
Evaluating End-User Experience Management Solutions
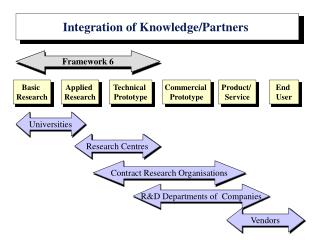
The Performance Monitoring Landscape • Application Performance Management • Frameworks • IBM Tivoli; HP Open VIew • Resource Monitoring Agents on Server • Example: i3 and Solution Manager • Application logging and tracing • Example: SAP BASIS • J2EE and .Net Applications Management • CA Wily Introscope; Avicode • End-User Experience Management • HTTP Network Appliances • Example: HP RUM; CA Wily CEM • Synthetic Transactions (scripting) • Example: HP Business Process Monitor; SAP End-Use Monitor • End-User Passive Agents • Example: Knoa/SAP UEM
How to Make Sense of it?Evaluation Criteria for End-User Monitoring • What are you measuring? • Where is it measured? • Effort Required to Set up and Maintain? • Who Uses the information/metrics?
Evaluation Criteria 1: Where does it measure? SimulatedEnd-User RealEnd-User Mainframe Network Router Firewall Switch Load Web Application Database Tier Balancer Tier Tier Tier A Myriad Or Network Monitoring Tools HP Open View SAP End-User Monitor SAP UEM by Knoa CA Wily CEM CA Wily Introscope
Evaluation Criteria 2: What does it measure? SimulatedEnd-User RealEnd-User Mainframe Network Router Firewall Switch Load Web Application Database Tier Balancer Tier Tier Tier A Myriad Or Network Monitoring Tools HP Open View SAP End-User Monitor SAP UEM by Knoa CA Wily CEM CA Wily Introscope Real TransactionResponse Times Run-Time Quality Real Utilization User Behavior & Workflow User Proficiency User Performance Response Times For Scripted Synthetic Transaction Proxies Real Transaction Response Times (minus) -- LAN/WAN Latency-- Desktop Processing-- Rendering Application Behavior andInteraction withInfrastructure Components ResourceUtilization & Availability Of InfrastructureComponents
Evaluation Criteria 3: What do YOU need to do SimulatedEnd-User RealEnd-User Mainframe Network Router Firewall Switch Load Web Application Database Tier Balancer Tier Tier Tier A Myriad Of Network Monitoring Tools HP Open View SAP End-User Monitor SAP UEM by Knoa CA Wily CEM CA Wily Introscope Install the “out of box” product Build scripts For each Transactionyou want tomonitor Back-out any live Transactions Maintain Scripts Every time you change the transactions Build scripts for each Transaction you want to monitor Maintain scripts every time you change the transactions Install the “out of box” product Install the “out of box” product • The implications are manifest in: • Time to value • Cost of implementation • Fragility of monitoring solution to change • Cost of ongoing ownership
Evaluation Criteria 4: Who Uses the Information SimulatedEnd-User RealEnd-User Mainframe Network Router Firewall Switch Load Web Application Database Tier Balancer Tier Tier Tier A Myriad Or Network Monitoring Tools HP Open View SAP End-User Monitor SAP UEM by Knoa CA Wily CEM CA Wily Introscope Application Performance Managers PerformanceManagers Change Managers End-UserSupport Training ProcessManagement Application Support Application Engineering Quality Managers IT Ops IT Ops ApplicationPerformance Managers Application Support Application Development IT Ops
Why Measure End-User Experience? “The uptake of end-user experience monitoring is not surprising. It is almost tautological to say that a user's or customer's opinion of an IT-enabled service will be a function of his or her experience of that service. Unless there is some way to track, or at least infer, the quality of that experience, then the service provider (whether internal or external) will be in the dark regarding the most fundamental dimension of its relationship with the service.” Will Cappelli, Vice President Gartner
Why Measure End-User Experience? • Best in Class Companies: • Proactively identify faults 82 percent of the time, compared to only 36 percent for all other companies • 99.4 percent average application availability, compared to 83.7 percent for laggards • 30 percent decrease in end-user complaints due to application issues in the past 12 months, while laggards saw a 4 percent increase. • The best-in class respondents in this research initiative were over twice as likely to improve brand reputation and • 75 percent more likely to improve employee productivity. Monitoring the End-User Experience Improving Business Performance Through Application Management Aberdeen Research June, 2009
Evaluating End-User Experience Management Solutions Serious Back-up Material
SAP PSFT Firewall Mainframe Router Database Web Servers Applications Frameworks • Frameworks measure availability of the infrastructure not degradations in response time. Siebel • Key Vendors: CA IBM Tivoli HP BMC Load Balancer Network Portal Switch Web Services Databases • Disadvantages: Don’t measure response time Don’t measure any metrics internal to the application Don’t capture end-user perspective • Advantages: Works for most applications Are the well understoodincumbent method Easy to implement for comprehensiveinfrastructure monitoring 3rd Party Applications
SAP PSFT Load Balancer Firewall Mainframe Router Database Web Servers Applications Server-Based Agents • Server agents measure the key resources (CPU, Memory, Disk I/O, Disk Capacity, and Network I/O) used by each application. Performance problems are related to misuse of resources, not degradations in response time. Agent Agent Agent Siebel • Key Vendors: CA (Unicenter) IBM (Tivoli IT CAM) HP (System Availability Center) BMC (Patrol) Agent Agent Agent Network Portal Switch Agent Web Services Databases Agent • Disadvantages: Don’t measure end-userexperienced response times Lots of ‘false positive’ alerts Get broken by Virtualization/Cloud/SaaS • Advantages: Works for most applications Are the well understoodincumbent method 3rd Party Applications Agent
SAP PSFT Load Balancer Firewall Mainframe Router Database Web Servers Applications Applications Server Monitoring • These products measure web server response time, and dive deeply into the J2EE applications server or .Net applications server supporting the business rules layer of the application. Siebel • Key Vendors: CA (Wily Introscope) IBM (IT CAM) HP (Diagnostics andProblem Isolation) Compuware Agent Agent Network Portal Switch Web Services Databases • Advantages: Works for most J2EE or .Netweb application Provide drill down diagnosticsinto application and DB layers • Disadvantages: • Only work for certain application architectures • Does not capture end-user experience(response times) • Get broken Virtualization, Cloud, SaaS 3rd Party Applications
SAP PSFT Load Balancer Firewall Mainframe Router Database Web Servers Applications Application Monitoring, Logging and Tracing Technologies • Detailed monitoring and capture of real application execution. Agent Agent Agent Siebel • Key Vendors: CA (Unicenter) IBM HP BMC (Patrol) Agent Agent Agent Network Portal Switch Agent Web Services Databases Agent • Advantages: Works for most applications Helps pinpoint the root cause of application issues Very effective for reactive probleminvestigation • Disadvantages: Does not show real user experience High overhead limits use as full-timeproduction monitoring solution High data volumes make analysis costly and difficult 3rd Party Applications Agent
Different Types of End-User Monitoring Solutions • Synthetic Transactions (Active Agents) • HTTP Network Appliances (Passive Monitoring) • Passive End-User Agents
SAP PSFT Load Balancer Firewall Mainframe Router Database Web Servers Applications Synthetic Transaction Scripts • Script agents are installed on selected desktops. Key transactions are run before users start the work day. Allows for verification of key processes before they are needed in production. Siebel Script • Key Vendors: • HP BAC • Compuware • BMC TM-ART • SAP (SolMan EEM) Network Portal Switch Script Web Services Databases • Disadvantages: • Script creation/maintenance • Simulation, not user reality • Get broken by virtualization process • No visibility into backend processes • Advantages: • Measure response timesand transaction times • Provide pre-emptivemonitoring and diagnostics 3rd Party Applications
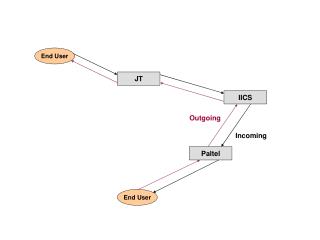
SAP PSFT Load Balancer Firewall Mainframe Router Database Web Servers Applications HTTP Network Appliances • HTTP appliances sit on a mirror or spanned port of the switch that supports the load balancers and web servers. They see every HTTP transaction, and measure its response time. Request Siebel • Key Vendors: CA (Wily CEM) Coradiant HP (RUM) Compuware Network Portal Switch Response Web Services Databases • Advantages: Works for most web applications See response timesat the web server level Are not impacted byvirtualization • Disadvantages: Every transaction must be defined Miss the end-user perspective Only work for HTTP/S apps No visibility into backend processes 3rd Party Applications
SAP PSFT Load Balancer Firewall Mainframe Router Database Web Servers Applications End-user Passive Agent – Knoa’s Approach • Knoa’s end-user passive agent sit on the end-user workstations. Knoa has deep understanding of actual applications and transactions being monitored Request • Key Vendor: • Knoa Software Siebel Agent Network Portal Switch Agent Web Services Response • Advantages: Measures complete round trip end-userresponse times • Provides end-usermetrics for both system & user errors • Captures user workflow and utilization • Supports Virtualized environments Databases • Disadvantages: • No visibility into backend processes • (metrics to be correlated with • back end solutions) 3rd Party Applications
Evaluation Criteria 1 : What are you measuring? Industry Analysts increasingly acknowledge that It is important to measure end-user behavior, and total Quality of Experience, not just response times. Not only does a desktop-based agent better reflect the true end-user experience — which the desktop’s performance could strongly influence — but it also provides insight into other parameters such as application usability and end-user behavior. The preliminary conclusion that we can reach by looking at the type of information provided is that while appliance-based solutions mostly address the business and IT operations, desktop-based solutions address both IT operations and the application development side of the IT organization.”
Evaluation Criteria 2: Where is it measured? Industry Analysts are confirming that the best point of for capture of end-user metrics is The end-user interface “As applications become more modular, distributed, volatile and interdependent, the only vantage point from which one can gather data that pertains to a given application as an integral whole is the user or customer interface. It would be accurate to say that it (the application) does not exist as an integral whole to be monitored, except as it was being consumed by a user or customer.”
End-User Behavior Capture Is Critical Function “Vendors will offer all four varieties as components of a single integrated approach to end-user experience monitoring, but the second variety (passive monitoring with network appliance) will likely be subsumed by the third (end-user behavior capture and playback)”.
Knoa Industry Leadership “Knoa EPM is a Leader in Passive Agent end-user monitoring” Knoa is increasingly recognized as the innovation leader by Industry analysts and pundits “Knoa Software is a Cool Vendor” “The Leader in Driving End-user Productivity” “Overall we are very impressed with Knoa” “Knoa’s products are a gift for our troubled times”
Analyst Support for Knoa’s Product & Technology • Knoa Software's solution in this market is grounded in its vision of fulfilling all the End-User experience measurement needs of IT organizations." • Knoa is an especially good fit for buyers that: • · Focus on true end-user experience monitoring. Knoa’s contention is that many difficulties arise from application usability issues. Consequently, their solution is very strong in analyzing errors and problems at that level. • · Want a product that crosses IT operation and application development boundaries. In an integrated IT organization that cares for the end-user experience, it is probably as important to create applications that are easy to use and minimize usability issues as it is to provide good online performance. Knoa’s product allows the whole IT organization to work together on improving end-user productivity.
Analyst Support for Knoa’s Product & Technology • "Knoa is cool because application usability and end-user performance are increasingly important metrics for measuring the value and performance of an enterprise's application portfolio. If users do not, or cannot, effectively utilize applications, then projects fail, so end-user performance and satisfaction are critical. This requires monitoring and measuring the end-user experience using this insight to target continuous improvement projects." -Dwight Klappich, Research Director, Gartner Inc. • "We looked at several vendors in the space and chose Knoa Experience and Performance Manager (EPM) as a leader because it set a very high standard when it comes to looking at end-user productivity metrics for corporate business applications, offering demonstrable ROI. • Knoa is able to document and separate 'received experience' from 'achieved experience' and the granularity with which Knoa can examine these two areas is distinctively rich compared to all the other vendors evaluated." -Dennis Drogseth, Vice President Enterprise Management Associates • "Overall, Butler Group is impressed with Knoa EPM, and believes that this pioneering solution will be extremely beneficial to all application stakeholders and, when used extensively, could set the application development function on a continuous improvement path. • Butler Group believes that Knoa's strategy for focusing on common business applications and being the single source of end-user performance metrics for all applications is the right one. • Given Knoa's innovative approach and that the end-user behaviour monitoring piece is missing from the stable of the IT performance management vendors, Knoa has a bright future ahead in Butler Group's opinion." " -Michael Azoff, Vice President, Butler Group