Download

1 / 49
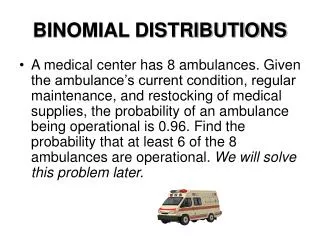
490 likes | 503 Views
Lesson 97 - Binomial Distributions. IBHL2 - Santowski. Opening Exercise:. Example #1: (a) Use a tree diagram to answer the following: You throwing a bent coin 3 times where P(H) = 1 / 5 (b) THUS, find the probability of gaining 2 heads Example #2:

E N D
Lesson 97 - Binomial Distributions IBHL2 - Santowski
Opening Exercise: • Example #1: • (a) Use a tree diagram to answer the following: You throwing a bent coin 3 times where P(H) = 1/5 • (b) THUS, find the probability of gaining 2 heads • Example #2: • (a) Use the FCP and combinatorics to analyse the scenario where we now toss the coin 4 times and find the probability of gaining 2 heads
Example: Throwing a bent coin 3 times where P(H) = 1/5 Find the probability of gaining 2 heads H HHH 1/5 H 4/5 1/5 HHT T H 4/5 H HTH 1/5 1/5 T 4/5 HTT T H THH 1/5 4/5 H 1/5 4/5 T THT T 1/5 H TTH 4/5 T 4/5 TTT T
P(3 Heads) = 1 x P(2 Tails) =3 x P(3 Tails) =1 x P(2 Heads) = 3 x HHH HHT HTH Notice the pattern 1 3 3 1 HTT THH THT TTH TTT
P(4 Heads) = 1 x If the coin was thrown 4 times it would look like this: P(2 Heads) =6 x P(0 Heads) =1 x P(1 Heads) =4 x P(3 Heads) = 4 x The number of ways of achieving a particular outcome can be calculated as: nCx Where n is the number of trials and x is the number of required outcomes.
Objectives/Assignment • How to determine if a probability experiment is a binomial experiment • How to find binomial probabilities using the binomial probability table and technology • How to construct a binomial distribution and its graph • How to find the mean, variance and standard deviation of a binomial probability distribution
Binomial Experiments • There are many probability experiments for which the results of each trial can be reduced to two outcomes: success and failure. For instance, when a basketball player attempts a free throw, he or she either makes the basket or does not. Probability experiments such as these are called binomial experiments.
Definition • A binomial experiment is a probability experiment that satisfies the following conditions: 1. The experiment is repeated for a fixed number of trials, where each trial is independent of the other trials. 2. There are only two possible outcomes of interest for each trial. The outcomes can be classified as a success (S) or as a failure (F). 3. The probability of a success, P(S), is the same for each trial. 4. The random variable, x, counts the number of successful trials.
Note: • Here is a simple example of binomial experiment. • From a standard deck of cards, you pick a card, note whether it is a club or not, and replace the card. You repeat the experiment 5 times, so n = 5. The outcomes for each trial can be classified in two categories: S = selecting a club and F = selecting another suit. The probabilities of success and failure are: p = P(S) = ¼ and q = P(F) = ¾. The random variable x represents the number of clubs selected in the 5 trials. So, the possible values of the random variable are 0, 1, 2, 3, 4, and 5. Note that x is a discrete random variable because its possible values can be listed.
Ex. 1: Binomial Experiments • Decide whether the experiment is a binomial experiment. If it is, specify the values of n, p and q and list the possible values of the random variable, x. If it is not, explain why. 1. A certain surgical procedure has an 85% chance of success. A doctor performs the procedure on eight patients. The random variable represents the number of successful surgeries.
Ex. 1: Binomial Experiments Solution: the experiment is a binomial experiment because it satisfies the four conditions of a binomial experiment. In the experiment, each surgery represents one trial. There are eight surgeries, and each surgery is independent of the others. Also, there are only two possible outcomes for each surgery—either the surgery is a success or it is a failure. Finally, the probability of success for each surgery is 0.85. n = 8 p = 0.85 q = 1 – 0.85 = 0.15 x = 0, 1, 2, 3, 4, 5, 6, 7, 8
Ex. 1: Binomial Experiments • Decide whether the experiment is a binomial experiment. If it is, specify the values of n, p and q and list the possible values of the random variable, x. If it is not, explain why. 2. A jar contains five red marbles, nine blue marbles and six green marbles. You randomly select three marbles from the jar, without replacement. The random variable represents the number of red marbles.
Ex. 1: Binomial Experiments Solution: The experiment is not a binomial experiment because it does not satisfy all four conditions of a binomial experiment. In the experiment, each marble selection represents one trial and selecting a red marble is a success. When selecting the first marble, the probability of success is 5/20. However because the marble is not replaced, the probability is no longer 5/20. So the trials are not independent, and the probability of a success is not the same for each trial.
Binomial Probabilities There are several ways to find the probability of x successes in n trials of a binomial experiment. One way is to use the binomial probability formula. Binomial Probability Formula In a binomial experiment, the probability of exactly x successes in n trials is:
Ex. 2 Finding Binomial Probabilities Roll 1 Roll 2 Roll 3 A six sided die is rolled 3 times. Find the probability of rolling exactly one 6. You could use a tree diagram
Ex. 2 Finding Binomial Probabilities There are three outcomes that have exactly one six, and each has a probability of 25/216. So, the probability of rolling exactly one six is 3(25/216) ≈ 0.347. Another way to answer the question is to use the binomial probability formula. In this binomial experiment, rolling a 6 is a success while rolling any other number is a failure. The values for n, p, q, and x are n = 3, p = 1/6, q = 5/6 and x = 1. The probability of rolling exactly one 6 is: Or you could use the binomial probability formula
Ex. 2 Finding Binomial Probabilities By listing the possible values of x with the corresponding probability of each, you can construct a binomial probability distribution.
Ex. 3: Constructing a Binomial Distribution In a survey, American workers and retirees are asked to name their expected sources of retirement income. The results are 36% of working Americans expect to rely on social security for retirement income Seven workers who participated in the survey are asked whether they expect to rely on social security for retirement income. Create a binomial probability distribution for the number of workers who respond yes.
Solution Given that 36% of working Americans expect to rely on social security for retirement income. So, p = 0.36 and q = 0.64. Because n = 7, the possible values for x are 0, 1, 2, 3, 4, 5, 6 and 7. Notice all the probabilities are between 0 and 1 and that the sum of the probabilities is 1.
Note: • Finding binomial probabilities with the binomial formula can be a tedious and mistake prone process. To make this process easier, you can use a binomial probability. Tables provide lists of the binomial probability for selected values of n and p. • EXAMPLE: Fifty percent of working adults spend less than 20 minutes commuting to their jobs. If you randomly select six working adults, what is the probability that exactly three of them spend less than 20 minutes commuting to work? Use a table to find the probability.
Ex. 4: Finding a Binomial Probability Using a Table • Fifty percent of working adults spend less than 20 minutes commuting to their jobs. If you randomly select six working adults, what is the probability that exactly three of them spend less than 20 minutes commuting to work? Use a table to find the probability. Solution: A portion of Table 2 is shown here. Using the distribution for n = 6 and p = 0.5, you can find the probability that x = 3, as shown by the highlighted areas in the table. The probability if you look at n = 6 and x = 3 over to 0.50 is .312.
Ex. 5 Using Technology to find a Binomial Probability An even more efficient way to find binomial probability is to use a calculator or a computer. For instance, you can find binomial probabilities by using your TI-83, TI-84 or Excel on the computer. Go to 2nd VARS on your calculator. Arrow down to binompdf which is choice A. Click Enter. This will give the command. Enter binompdf(6, .5, 3) (6 trials, a 0.50 probability of success, and 3 “successes”). The comma button is located above the 7 on your calculator. You should get 0.3125
Ex. 6: Finding Binomial Probabilities • A survey indicates that 41% of American women consider reading as their favorite leisure time activity. You randomly select four women and ask them if reading is their favorite leisure-time activity. Find the probability that: • (1) exactly two of them respond yes, • (2) at least two of them respond yes, and • (3) fewer than two of them respond yes.
Ex. 6: Finding Binomial Probabilities • #1--Using n = 4, p = 0.41, q = 0.59 and x =2, the probability that exactly two women will respond yes is: Calculator or look it up on pg. A10
Ex. 6: Finding Binomial Probabilities • #2--To find the probability that at least two women will respond yes, you can find the sum of P(2), P(3), and P(4). Using n = 4, p = 0.41, q = 0.59 and x =2, the probability that at least two women will respond yes is: Calculator or look it up on pg. A10
Ex. 6: Finding Binomial Probabilities • #3--To find the probability that fewer than two women will respond yes, you can find the sum of P(0) and P(1). Using n = 4, p = 0.41, q = 0.59 and x =2, the probability that at least two women will respond yes is: Calculator or look it up on pg. A10
Ex. 7: Constructing and Graphing a Binomial Distribution • 65% of American households subscribe to cable TV. You randomly select six households and ask each if they subscribe to cable TV. Construct a probability distribution for the random variable, x. Then graph the distribution.
Ex. 7: Constructing and Graphing a Binomial Distribution • 65% of American households subscribe to cable TV. You randomly select six households and ask each if they subscribe to cable TV. Construct a probability distribution for the random variable, x. Then graph the distribution.
Ex. 7: Constructing and Graphing a Binomial Distribution • 65% of American households subscribe to cable TV. You randomly select six households and ask each if they subscribe to cable TV. Construct a probability distribution for the random variable, x. Then graph the distribution. Because each probability is a relative frequency, you can graph the probability using a relative frequency histogram as shown on the next slide.
Ex. 7: Constructing and Graphing a Binomial Distribution • Graph of the distribution. Relative Frequency NOTE: that the histogram is skewed left. The graph of a binomial distribution with p > .05 is skewed left, while the graph of a binomial distribution with p < .05 is skewed right. The graph of a binomial distribution with p = .05 is symmetric. Households
Mean, Variance and Standard Deviation • Although you can use the formulas learned in 4.1 for mean, variance and standard deviation of a probability distribution, the properties of a binomial distribution enable you to use much simpler formulas. They are on the next slide.
Population Parameters of a Binomial Distribution Mean: = np Variance: 2 = npq Standard Deviation: = √npq
Ex. 8: Finding Mean, Variance and Standard Deviation • In Pittsburgh, 57% of the days in a year are cloudy. Find the mean, variance, and standard deviation for the number of cloudy days during the month of June. What can you conclude?
Ex. 8: Finding Mean, Variance and Standard Deviation • In Pittsburgh, 57% of the days in a year are cloudy. Find the mean, variance, and standard deviation for the number of cloudy days during the month of June. What can you conclude? Solution: There are 30 days in June. Using n=30, p = 0.57, and q = 0.43, you can find the mean variance and standard deviation as shown. Mean: = np = 30(0.57) = 17.1 Variance: 2 = npq = 30(0.57)(0.43) = 7.353 Standard Deviation: = √npq = √7.353 ≈2.71
Example • (a) Using a biased coin where P(H) = 0.55 what is the probability of • achieving 6 heads when the coin is thrown 8 times. • (b) A card is to be drawn from a well shuffled pack and then replaced. • This is repeated 10 times. • (i) What is the probability of drawing an Ace 6 times. • (ii) What is the probability of drawing an Ace at least twice.
Example: Using a biased coin where P(H) = 0.55 what is the probability of achieving 6 heads when the coin is thrown 8 times. 8C6 x 0.556 x 0.452 = 0.157 In general: P(X=x) = nCxx pxq(n-x) Where n = number of trials p = probability of success q = probability of failure x = number of required successes A binomial distribution can be described as: P(X=x) ~B(n,p)
Example: A card is to be drawn from a well shuffled pack and then replaced. This is repeated 10 times. What is the probability of drawing an Ace 6 times. 10C6 x 10C0 x 10C1 x = 3.159 x 10⁻⁵ What is the probability of drawing an Ace at least twice. 1 – P(X<2) = 1 – (P(X=0)+P(X=1)) 1 – ( + ) = 0.177
Example • 1. Hockey cards, chosen at random from a set of 20, are • given away inside cereal boxes. Stan needs one more • card to complete his set so he buys five boxes of cereal. • What is the probability that he will complete his set?
Example • 1. Hockey cards, chosen at random from a set of 20, are • given away inside cereal boxes. Stan needs one more • card to complete his set so he buys five boxes of cereal. • What is the probability that he will complete his set? P(x successes) = nCxpxqn - x = 0.2 The probability of Stan completing his set is 20%.
Binomial Distribution - Applications 2. Seven coins are tossed. What is the probability of four tails and three heads? 3. A true-false test has 12 questions. Suppose you guess all 12. What is the probability of exactly seven correct answers?
Binomial Distribution - Applications 2. Seven coins are tossed. What is the probability of four tails and three heads? P(x successes) = nCxpxqn - x n = 7 (number of trials) P(4 successes) = x = 4 (number of successes) = 0.273 p = (probability of success) The probability of four heads and three tails is 27%. q = (probability of failure) 3. A true-false test has 12 questions. Suppose you guess all 12. What is the probability of exactly seven correct answers? P(x successes) = nCxpxqn - x n = 12 (number of trials) x = 7 (number of successes) P(7 successes) = p = (probability of success) = 0.193 The probability of seven correct answers is 19%. q = (probability of failure)
Binomial Distribution - Applications 4. A test consists of 10 multiple choice questions, each with four possible answers. To pass the test, one must answer at least nine questions correctly. Find the probability of passing, if one were to guess the answer for each question.
Binomial Distribution - Applications 4. A test consists of 10 multiple choice questions, each with four possible answers. To pass the test, one must answer at least nine questions correctly. Find the probability of passing, if one were to guess the answer for each question. P(x successes) = nCxpxqn - x P(x successes) = P(9 successes) + P(10 successes) = 0.000 0296 The probability of passing is 0.003%.
Binomial Distribution - Applications • A family has nine children. What is the • probability that there is at least one girl?
Binomial Distribution - Applications • A family has nine children. What is the • probability that there is at least one girl? This can be best solved using the compliment, that is, the probability of zero girls: n = 9 (number of trials) P(x successes) = nCxpxqn - x x = 0 (number of successes) P(0 successes) = p = (probability of success) = 0.001 95 n = (probability of failure) The probability of zero girls is 0.001 95, therefore the probability of at least one girl is 1 - 0.001 95 = 0.998.
Binomial Distribution - Applications • While pitching for the Toronto Blue Jays, 4 of every 7 pitches • Juan Guzman threw in the first 5 innings were strikes. What is • the probability that 3 of the next 4 pitches will be strikes?
Binomial Distribution - Applications • While pitching for the Toronto Blue Jays, 4 of every 7 pitches • Juan Guzman threw in the first 5 innings were strikes. What is • the probability that 3 of the next 4 pitches will be strikes? Let’s assume that there are only two possible outcomes, strikes or balls. P(x successes) = nCxpxqn - x n = 4 (number of pitches) x = 3 (number of strikes) P(3 successes) = p = (probability of success) = 0.32 q = (probability of failure) Note: will also yield the same result.
Using the Binomial Theorem to Calculate Probabilities [cont’d] You can use the table feature of a graphing calculator to calculate probabilities. The table shows the probability for any number of correct guesses. Using the Binomial Probability Distribution feature of the TI-84: 0: binompdf DISTR binompdf (number of trials, probability of success, x-value) n = 6 p = 0.17 P(6 successes) binompdf(6, 0.17, 6) = 0.000 021 4