Download
1 / 9
90 likes | 99 Views
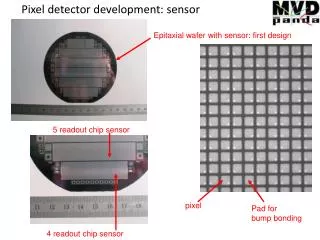
Opto temperature experience in the Pixel detector. C. Gemme IBL meeting, 17 March 2009. Pixel Optoboards. A quadrant with 36 optoboards, not visible.

E N D
Opto temperature experience in the Pixel detector C. Gemme IBL meeting, 17 March 2009
Pixel Optoboards A quadrant with 36 optoboards, not visible • 272 optoboards arranged on the Service Quarter Panels in groups of 36 per quadrant. Those 36 opto are arranged in six groups of six optoboards each. • One cooling loop per quadrant, eight for the detector, each one with independent temperature (pressure) setting. • To have more granularity in temperature control, on each quadrant, added six optoheaters, one per each six opto-row to regulate the temperature. • Two types of optoboards in terms of produced heat (D and B-boards) An optoheater on a six opto-row
Optoboards temperature Operation point in 2008 • Opto cooling loops set at 4.15 bara, i.e. 0C • Manually Set the optoheater in such a way that all opto have T>20C • 20-40% requested power for the optoheaters • ~22C average temperature of the optoboards, tails at higher temperatures Opto OFF
Temperature dispersion Operation point in 2008 • No way to recover not uniformity in the opto array, in particular when an optoboard is off or has high power (B-boards) • See for instance location 3,4 in OSP bottom and top have higher temperature as there the B-boards are located. Old data (May): ISP settings have been raised in Aug-Dec operation.
Temperature Working range • Ideally one would like to measure a temperature range in which there are no errors in data transmission for each optoboard and then derive the distribution for the full detector. • But How to define the optoboard data transmission efficiency? D Data transmission Efficiency 1 From the distribution of Tbest and D of the 272 optoboards get the temperature precision that is needed to operate. Tbest T
Temperature Working range • The best estimator as data transmission efficiency we have used for each module is related to the Error Free Region (EFR) size and shape in the BOC parameters, i.e. the white region in the upper plot (BOC Delay (x) vs BOC Threshold (y)). • But the definition of optoboard data transmission efficiency becomes more complicate: • one optoboard might have up to 14 channels to manage • the size/shape of the EFR depends on VISET (laser current) that is unique for all the channels the EFR of each channel has to be taken into account as well as the range of acceptable VISET settings, see next slide. • WE DO NOT HAVE (yet) such a definition. • And then it should be possible to study the dependence on Temperature…
ch0 ch1 ch2 ch3 ch4 ch5 ch6 Viset
Temperature dependence in 2008 • Even if no detailed study, we know that: • In early August Opto BPR set to 3.5 bar (~-5C ); optoheater setting to 5C. Optoboards temperature ~5-10 C: • Many (ADD A NUMBER!!) problems in operating the detector! • BOC Scans vs different temperature settings on part of the detector: • Only 6 PP0s all failing at 10C • Optoheaters settings at ~10C-13C-16C-19C-22C • Analysis on-going… • More tests could be done in SR1 if needed (14 PP0s there)
Not a conclusion… • It is complex to define a temperature range of good operation for the optoboards and it has not been done systematically neither during QC or on the final detector. • Some indications come indirectly from the commissioning period: • 5-10C is too low • ~22±3C is good • Not tested the high temperature range. • Analysis is on-going for temperature dependence studies done in September. • More tests could be done in SR1 if needed.