Download
1 / 20
200 likes | 348 Views
Shore-based, high-frequency surface current mapping radars in remote arctic settings Tom Weingartner 1 , Hank Statscewich 1 , Seth Danielson 1 Greg Egan 2 , Bruno Grunau 2 , Jeb Timm 2 1 Institute of Marine Science, University of Alaska, Fairbanks, AK 99775

E N D
Shore-based, high-frequency surface current mapping radars in remote arctic settings Tom Weingartner1, Hank Statscewich1, Seth Danielson1 Greg Egan2, Bruno Grunau2, Jeb Timm2 1Institute of Marine Science, University of Alaska, Fairbanks, AK 99775 2Remote Power, Inc., Fairbanks, AK 99712 Supported by: US Dept. of Homeland Security January 2011 CIMES Annual Meeting Honolulu, Hawaii
Project Objective: Acquire and transmit in realtime: surface current data for Arctic shelves Outline • Examples of radar data • Limiting factors (power) • The Remote Power Module (RPM) -design criteria -the prototype -preliminary results 5. Collaborations 6. Future Plans
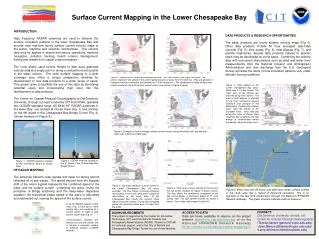
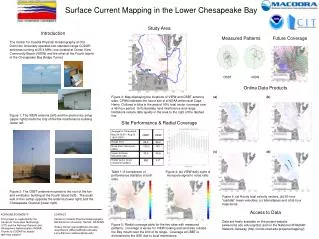
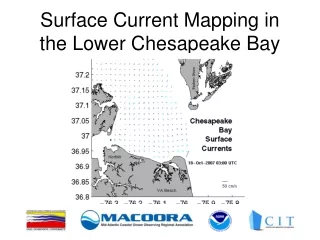
IX/20/2010: 0600 UTC • Coastal Radars map surface (upper 1 m) currents: • - hourly • over broad areas (~175 km) at • 6 km resolution • realtime access via web access • easily understandable • cost effective • To guide: • Response to marine spills • Search and rescue operations • Evaluate spill models • Vessel-tracking • To understand: • Ocean Dynamics • Marine Ecosystems ~4MHz Shore-based power available
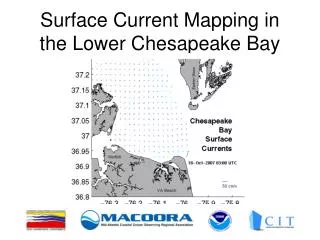
Mean Sep – Oct, 2006 Surface Velocity Field Alaskan Beaufort Sea October 2006 Mean winds: 10 m/s (20 kt) westward Mean Along-shelf Flow: 0.2 m/s (.4 kt) Inner shelf volume replaced in 45 days! 50 km eastward 12 MHz HFradar AC Power from oil industry permission construction activities westward
Problems • Needs shore-based AC power. • Where available, siting precludes optimal coverage. • Requires ~8kW hours/day; no off-the-shelf power supplies • Permitting (fossil-fuel), Maintenance, Logistics ($$$$) • Solution: Develop an autonomous power supply • The Remote Power Module (RPM)
Design Criteria: Modular (flexibility), portable; Monitor system performance; resilient/redundant power: ~5-day battery bank charged by Solar, Wind, and bio-diesel genset
Weight: 6000 lbs total (3,420 lbs in 36 batteries) Transport: 20’ Conex, each crate < 200 lbs (portable) Fairbanks – Prudhoe: 476 miles by truck Prudhoe – Barrow: 200 miles by barge
Triodetic Foundation & Wood Deck Refrigeration Hut Turbine Assembly PV Assembly
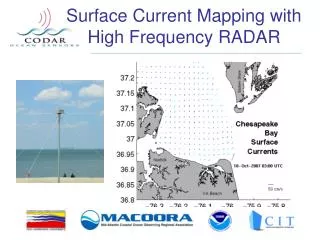
Remote Power Module test: Barrow, Fall 2010 Sat. comms Receive antenna Transmit antenna
Power Distributed to: 1. Battery bank or 2. Diversion Loads (heaters) Monitor: V, I, WS, PV, AT 1. Troubleshoot 2. Assess Performance 3. Heat Budgeting 4. Scaling Remote Control: 1. Generator 2. Fans, loads 3. HFR Data Handling: Stored & transmitted
Battery Bank Assembling Controllers (with quick connects) Control cans Data logger PV wind controllers fuses Relay Drivers
Met. Tower (Wind, solar, Air Temp.) Generator + 15 gals. Fuel (60 hours run time) Startup: Battery bank 50% SOC Shutdown: 80% SOC
Environmental Variables Insolation Wind Speed Air Temp 2010
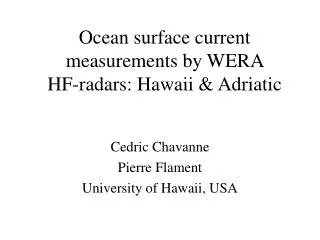
Battery Bank (26.7 v) Solar (7%) Wind (93%) 2010
Scaling (for other locations): Power vs. Wind Speed >11m/s Overspeed Control 7 m/s (test mean) <3m/s No Power 100% @ 5.5m/s
Collaborations I. The RPM generated more power than required and so could support: • USCG VHF transceivers for comms. and vessel locations • Marine Exchange of Ak (co-location of AIS transceivers) • Other sensors (Ice-radar, met., air sampling) • ~100 W solid-state thermo-electric air conditioners (hot climates, e.g., Puerto Rico, Hawaii, etc.) • Will provide Scott Glenn (Rutgers) with: • vessel positions from 2010 and 2011 for testing HFR vessel detection algorithms at high latitudes • Drifter data (2011 potentially) for SAROPS applications
Conclusions • HF radar operational during openwater season (August – November) • The Remote Power Module meets all design criteria. • 100% of power from renewables (Sept. – Nov.) • Maintained minimum battery SOC Future Plans • Chukchi HF measurements will continue in 2011 (Pt. Lay, Wainwright, and Barrow) • August test is critical (reduced winds, but more solar) • Documentation to expand accessibility by others e.g., local residents to conduct routine maintenance • Seek partners to expand RPM-HF systems in Chukchi and Beaufort.
Example Radar Mask: 8 Long-Range HF-RPM systems Coverage: 800 km (425 n. mi.) x 175km = 1.4x10⁶ km2 (~40,000 n.mi.2) Icy Pt. Pt. Cape Oliktok Flaxman Barter Demarcation Cape Franklin Barrow Halkett Pt. Is. Is. Bay