Download
1 / 7

E N D
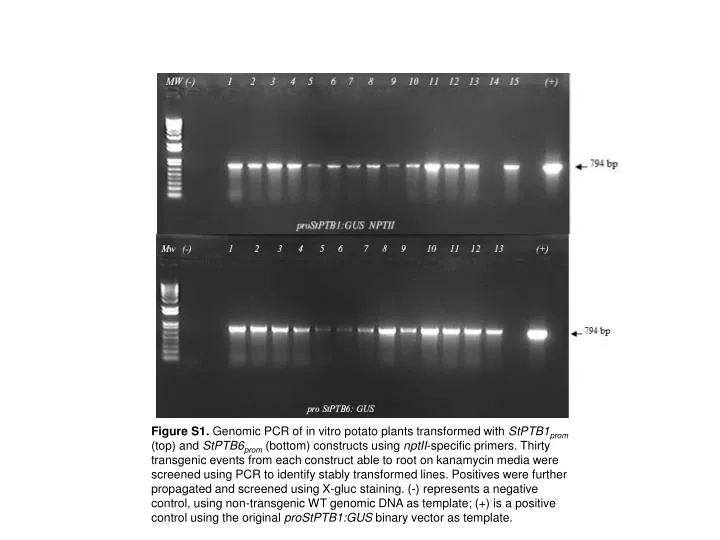
Figure S1. Genomic PCR of in vitro potato plants transformed with StPTB1prom(top) and StPTB6prom (bottom) constructs using nptII-specific primers. Thirtytransgenic events from each construct able to root on kanamycin media were screened using PCR to identify stably transformed lines. Positives were further propagated and screened using X-gluc staining. (-) represents a negative control, using non-transgenic WT genomic DNA as template; (+) is a positive control using the original proStPTB1:GUS binary vector as template.
Line 12 Line 22 Line 26 Line 22 Line 2 Line 16 Figure S2. Screen of StPTB1prom (left panels) and StPTB6prom (right panels) transgenic lines using 5-bromo-4-chloro-3-indolyl glucuronide (X-gluc) staining of whole in vitro plants. Lines positive for PCR were screened by staining with X-gluc for 16 hr to determine relative consistency and intensity of GUS staining across lines of the same construct. Plants were grown two weeks in vitro prior to staining and were evaluated in triplicate. The six representative lines chosen for further analyses are shown here.
Table S1. Promoter structure comparison of PTB genes from Arabidopsis (AtPTB3), potato (StPTB1 and -6), tobacco (Tobacco1 and -2) and tomato (Tomato1 and -2). Promoter structures were constructed by aligning full-length mRNA sequence with genomic sequence spanning approximately 1.8 kb upstream of the transcriptional start site (Upstream region) to the start codon of the coding sequence of each gene (5´ UTR). All genes analyzed here exhibited intronic sequence (Intron) within their 5´ UTRs. mRNA sequences of potato genes were generated using conventional cloning methods, whereas sequences from other species are derived from the TAIR database (AtPTB3; accession number AT1G43190) or the Sol Genomics Network (Tomato1 and -2; locus names Solyc12g019750 and Solyc10g080720, respectively, Tobacco1 and -2; locus names Niben.v0.3.Scf24895145 and Niben.v0.3.Scf25190834, respectively). Values are shown in bp.
Table S2. Identification of conserved cis-regulatory elements within potato (StPTB1 and 6) and tomato (Tomato 1 and 2) PTB gene promoters using Plant-CARE. Elements identified in each potato promoter were mapped and compared to their tomato ortholog to determine genetic conservation of each element. Conservation was scored by a tomato element being within 200 bp of a potato element of the same type. Percent conservation was calculated by the number of conserved elements and total elements within each potato promoter. The lengths of the upstream sequence analyzed were 2,519 nt for StPTB1; 2,587 nt for Tomato1 (PTB1-like); 3,593 nt for StPTB6; and 3,508 ntfor Tomato2(PTB6-like).
TSSR1.StPTB6 CTTTTAAGGAAA---AAGAATAATTA-ATAAA-GTACAA-AGAA------------AAGAAAAAAG TSSR1.Tomato2 CTTTTAAAGAAA---AAGAATAATTA-ATAAGTGTAGGA-AAAATATC-----ATTTTAAGAAAAT TSSR.patatin GTGCTAAACAATTTCAAGTCTCATCACACATATATATTATATAATACTAATAAAGAATAGAAAAAG * *** ** *** * ** * * * ** * * ** **** TSSR2.StPTB6 GTTGACT-GAAATTTAATCTCTACTAAAAAAAAAAACTCACTATAATTCAAGT-TAGAATTGAAAAAG TSSR2.Tomato2 TAAACATATAAATTTAA-GAAAAAAAATATAAAATGTTGATTATAATTCAAGT-TAGAATTGAAAAAG TSSR.patatin GTGCTAAACAATTTCAA-GTCTCATCACACATATATATT-ATATAATACTAATAAAGAATAGAAAAAG ** ** ** * * * * * ****** * * * ***** ******* TSSR3.StPTB6 GTCCTAATCTCTCT---GTGAATTTCCTAATATACCCTGCACAGTTGTGGAAATGAA-ATAAAAAG TSSR3.Tomato2 GATTTATTCGATAG--GCTCAGAT--GGCGAACAGTCTTCA---TCGCAGTAAAGCA-GGGAAAAG TSSR.patatin GTGCTAAACAATTTCAAGTCTCATCACACATATATATTATATAATACTAATAAAGAATAGAAAAAG * ** * * * * * * * * * ** * * ***** Figure S3. Alignment of conserved TSSR elements within potato and tomato PTB gene promoters. Three functional TSSR elements have been reported from the analysis of the patatin promoter with locations starting -143, -226 and -930 bp upstream of the transcriptional start site (Grierson et al. 1994). Similarly, three TSSR elements were discovered within the promoters of StPTB6, at locations -192, -291 and -992 bp, and its tomato ortholog, Tomato2, at locations -218, -291 and -1,003 bp. Each site was numbered based on its relative location to the transcriptional start site and aligned with the proximal -226 bp TSSR element from pat-1. The boxed sequences on the left and right correspond to cis-elements known to confer tuber-specificity and sucrose responsiveness, respectively, with the intervening bolded sequence designating a third element responsible for transcriptional repression in other organs. Asterisks indicate positions of identity match among all three sequences.
StPTB1 * * * * * StPTB6 * * MUG assay RT-PCR Figure S4. MUG assay for PTB promoter activity in transgenic lines and qRT-PCR for PTB1 and -6 transcript levels for WT plants under the same environmental conditions for light, heat, and cold treatments for 24 h. Control levels were measured before treatment (0h) or after 24h of darkness. The same leaflet assay described in the legend of Figure 7 was used. Terminal leaflets of wild-type plants were harvested for RNA extraction and One-step RT-PCR (Invitrogen) was performed with 90 ng RNA and 30 and 32 cycles for StPTB1 and -6, respectively, using the primer pairs 5´-CTCCCTTTCCTCCATTTCTGAAG-3´ (forward) and 5´-CGTAAACATTCCTCCCCCTTATGC-3´ (reverse) for StPTB1 and 5´-CTGGTCTTTCAAGCCCTAATTCTC-3´ (forward) and 5´-CACTTCTCCCCCTTATGCTG-3´ (reverse) for StPTB6. PCR products were quantified using ImageJ (Abramoff et al., 2004) and normalized using 18S rRNA values (y-axis). Relative values are shown. Standard errors of the means of three biological replicates are shown with asterisks indicating significant differences (p<0.05) from comparable controls using a student’s t-test.
20 d drought StPTB6prom 20 d watered StPTB6prom Figure S5. Effect of drought on plant growth of a StPTB6promtransgenic line. For the drought treatment (Fig. 7), whole plants were not watered for 20 days before harvesting undamaged terminal leaves. Control plants were watered every three days. Plants were grown in growth chambers (Percival Scientific) set to a 16-h-light (fluence rate of 300 µmol m-2 s-1) and 8-h-dark cycle with a 22 °C day temperature and a 18 °C night temperature. Both drought-treated WT and StPTB1promtransgenic lines exhibited similar phenotypes.