Download
1 / 1
10 likes | 115 Views
Rapid Determination of Earthquake Magnitude using GPS for Tsunami Warning Systems Geoffrey Blewitt, Corné Kreemer, William Hammond, and Hans-Peter Plag Nevada Bureau of Mines and Geology, and Seismological Laboratory, University of Nevada, Reno, NV 89557, USA, email: gblewitt@unr.edu

E N D
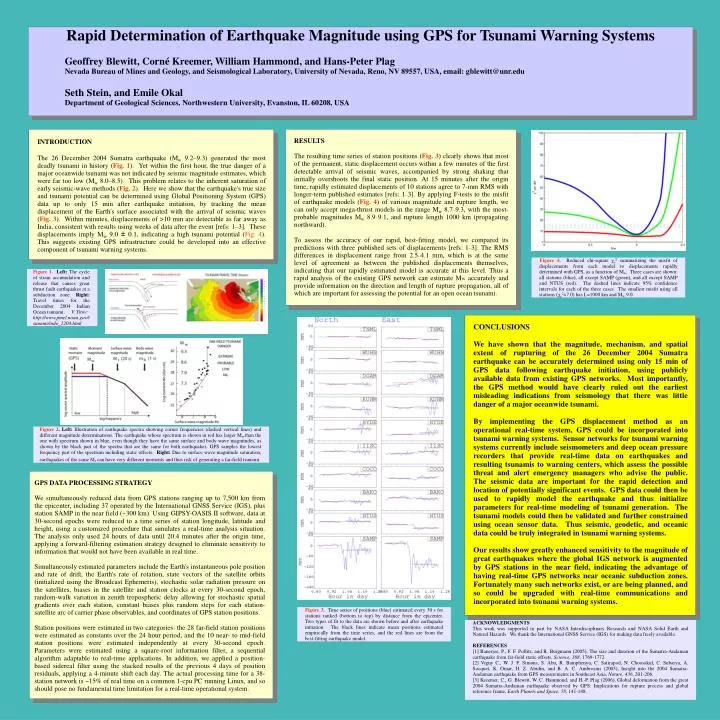
Rapid Determination of Earthquake Magnitude using GPS for Tsunami Warning Systems Geoffrey Blewitt, Corné Kreemer, William Hammond, and Hans-Peter Plag Nevada Bureau of Mines and Geology, and Seismological Laboratory, University of Nevada, Reno, NV 89557, USA, email: gblewitt@unr.edu Seth Stein, and Emile Okal Department of Geological Sciences, Northwestern University, Evanston, IL 60208, USA INTRODUCTION The 26 December 2004 Sumatra earthquake (Mw 9.2–9.3) generated the most deadly tsunami in history(Fig. 1). Yet within the first hour, the true danger of a major oceanwide tsunami was not indicated by seismic magnitude estimates, which were far too low (Mw 8.0–8.5). This problem relates to the inherent saturation of early seismic-wave methods (Fig. 2). Here we show that the earthquake's true size and tsunami potential can be determined using Global Positioning System (GPS) data up to only 15 min after earthquake initiation, by tracking the mean displacement of the Earth's surface associated with the arrival of seismic waves (Fig. 3). Within minutes, displacements of >10 mm are detectable as far away as India, consistent with results using weeks of data after the event [refs: 1–3]. These displacements imply Mw 9.0 ± 0.1, indicating a high tsunami potential (Fig. 4). This suggests existing GPS infrastructure could be developed into an effective component of tsunami warning systems. RESULTS The resulting time series of station positions (Fig. 3) clearly shows that most of the permanent, static displacement occurs within a few minutes of the first detectable arrival of seismic waves, accompanied by strong shaking that initially overshoots the final static position. At 15 minutes after the origin time, rapidly estimated displacements of 10 stations agree to 7-mm RMS with longer-term published estimates [refs: 1–3]. By applying F-tests to the misfit of earthquake models (Fig. 4) of various magnitude and rupture length, we can only accept mega-thrust models in the range Mw 8.7–9.3, with the most-probable magnitudes Mw 8.9–9.1, and rupture length 1000 km (propagating northward). To assess the accuracy of our rapid, best-fitting model, we compared its predictions with three published sets of displacements [refs: 1–3]. The RMS differences in displacement range from 2.5–4.1 mm, which is at the same level of agreement as between the published displacements themselves, indicating that our rapidly estimated model is accurate at this level. Thus a rapid analysis of the existing GPS network can estimate Mw accurately and provide information on the direction and length of rupture propagation, all of which are important for assessing the potential for an open ocean tsunami. Figure 4.Reduced chi-square χν2 summarizing the misfit of displacements from each model to displacements rapidly determined with GPS, as a function of Mw. Three cases are shown: all stations (blue), all except SAMP (green), and all except SAMP and NTUS (red). The dashed lines indicate 95% confidence intervals for each of the three cases. The smallest misfit using all stations (χν2=7.0) has L=1000 km and Mw 9.0. Figure 1. Left: The cycle of strain accumulation and release that causes great thrust fault earthquakes at a subduction zone. Right: Travel times for the December 2004 Indian Ocean tsunami. V. Titov: http://www.pmel.noaa.gov/tsunami/indo_1204.html CONCLUSIONS We have shown that the magnitude, mechanism, and spatial extent of rupturing of the 26 December 2004 Sumatra earthquake can be accurately determined using only 15 min of GPS data following earthquake initiation, using publicly available data from existing GPS networks. Most importantly, the GPS method would have clearly ruled out the earliest misleading indications from seismology that there was little danger of a major oceanwide tsunami. By implementing the GPS displacement method as an operational real-time system, GPS could be incorporated into tsunami warning systems. Sensor networks for tsunami warning systems currently include seismometers and deep ocean pressure recorders that provide real-time data on earthquakes and resulting tsunamis to warning centers, which assess the possible threat and alert emergency managers who advise the public. The seismic data are important for the rapid detection and location of potentially significant events. GPS data could then be used to rapidly model the earthquake and thus initialize parameters for real-time modeling of tsunami generation. The tsunami models could then be validated and further constrained using ocean sensor data. Thus seismic, geodetic, and oceanic data could be truly integrated in tsunami warning systems. Our results show greatly enhanced sensitivity to the magnitude of great earthquakes where the global IGS network is augmented by GPS stations in the near field, indicating the advantage of having real-time GPS networks near oceanic subduction zones. Fortunately many such networks exist, or are being planned, and so could be upgraded with real-time communications and incorporated into tsunami warning systems. Figure 2. Left: Illustration of earthquake spectra showing corner frequencies (dashed vertical lines) and different magnitude determinations. The earthquake whose spectrum is shown in red has larger Mw than the one with spectrum shown in blue, even though they have the same surface and body wave magnitudes, as shown by the black part of the spectra that are the same for both earthquakes. GPS samples the lowest frequency part of the spectrum including static offsets. Right: Due to surface wave magnitude saturation, earthquakes of the same Ms can have very different moments and thus risk of generating a far-field tsunami. GPS DATA PROCESSING STRATEGY We simultaneously reduced data from GPS stations ranging up to 7,500 km from the epicenter, including 37 operated by the International GNSS Service (IGS), plus station SAMP in the near field (~300 km). Using GIPSY-OASIS II software, data at 30-second epochs were reduced to a time series of station longitude, latitude and height, using a customized procedure that simulates a real-time analysis situation. The analysis only used 24 hours of data until 20.4 minutes after the origin time, applying a forward-filtering estimation strategy designed to eliminate sensitivity to information that would not have been available in real time. Simultaneously estimated parameters include the Earth's instantaneous pole position and rate of drift, the Earth's rate of rotation, state vectors of the satellite orbits (initialized using the Broadcast Ephemeris), stochastic solar radiation pressure on the satellites, biases in the satellite and station clocks at every 30-second epoch, random-walk variation in zenith tropospheric delay allowing for stochastic spatial gradients over each station, constant biases plus random steps for each station-satellite arc of carrier phase observables, and coordinates of GPS station positions. Station positions were estimated in two categories: the 28 far-field station positions were estimated as constants over the 24 hour period, and the 10 near- to mid-field station positions were estimated independently at every 30-second epoch. Parameters were estimated using a square-root information filter, a sequential algorithm adaptable to real-time applications. In addition, we applied a position-based sidereal filter using the stacked results of the previous 4 days of position residuals, applying a 4-minute shift each day. The actual processing time for a 38-station network is ~15% of real time on a common 1-cpu PC running Linux, and so should pose no fundamental time limitation for a real-time operational system. Figure 3.Time series of positions (blue) estimated every 30 s for stations ranked (bottom to top) by distance from the epicenter. Two types of fit to the data are shown before and after earthquake initiation. The black lines indicate mean positions estimated empirically from the time series, and the red lines are from the best-fitting earthquake model. ACKNOWLEDGMENTS This work was supported in part by NASA Interdisciplinary Research and NASA Solid Earth and Natural Hazards. We thank the International GNSS Service (IGS) for making data freely available. REFERENCES [1] Banerjee, P., F. F. Pollitz, and R. Burgmann (2005), The size and duration of the Sumatra-Andaman earthquake from far-field static offsets, Science, 308, 1769-1772. [2] Vigny C., W. J. F. Simons, S. Abu, R. Bamphenyu, C. Satirapod, N. Choosakul, C. Subarya, A. Socquet, K. Omar, H. Z. Abidin, and B. A. C. Ambrosius (2005), Insight into the 2004 Sumatra-Andaman earthquake from GPS measurements in Southeast Asia, Nature, 436, 201-206. [3] Kreemer, C., G. Blewitt, W. C. Hammond, and H.-P. Plag (2006), Global deformation from the great 2004 Sumatra-Andaman earthquake observed by GPS: Implications for rupture process and global reference frame, Earth Planets and Space, 58, 141-148.