Download
1 / 34
350 likes | 471 Views
Performance Metrics for Weatherization. David Carroll State WAP Evaluations ACI Home Performance Conference April 30, 2014. What is Performance Measurement?. 2. Step 1 - Goals. What are your goals? Are you trying to serve a certain population? Are you trying to affect … Energy use?

E N D
Performance Metrics for Weatherization David Carroll State WAP Evaluations ACI Home Performance Conference April 30, 2014
Step 1 - Goals • What are your goals? • Are you trying to serve a certain population? • Are you trying to affect … • Energy use? • Energy costs? • Payment problems? • Emissions? • Health problems? • How will you know when you are successful? 3
Step 2 – Measurement • Overall Research • Who are you serving? • How are you serving them? • What are they saving? • What other benefits are you delivering? • Comparative Research • What approach maximizes energy, cost, payment, emissions, health impacts? 4
Step 3 - Assessment • Assessment • What are your goals for your program? • Does your performance match your goals? • How can you better align your performance with your goals? 5
Step 4 – Improvement • Strategies • Changing who you serve • Targeting • Partnerships • Changing what you deliver • Assessments • Measures 6
Step 4 - Improvement • Strategies (continued) • Changing your performance • Comparative analysis • Mentoring / partnerships • Changing funding available • Leveraging • Advocacy 7
Benchmark • Use data on …. • Population / Census Data (ACS) • Recipients / LIHEAP or Energy Assistance • WX Clients / Demographics, Housing Units, Baseline Conditions 9
Observe • Observations of …. • Intake • Audits • Service Delivery • Inspections 10
Measure • Collect data on …. • Installed Measures • Post-WX Conditions • Pre/Post Energy Usage • Client Outcomes – Payments, Housing, Health 11
Analyze • Study …. • Gross changes in weather-normalized usage • Net changes using a comparison group • Variations in outcomes by key client, building, and program factors 12
Assessment • Investigate… • Why are some subgroups seeing high impacts? • Why are some subgroups seeing low impacts? • What strategies might be tested to better align outcomes with goals? 13
Who are you Serving? Example of using Census and LIHEAP data as a Benchmark 14
Minnesota Households - 2010 About one in four Minnesota households were income-eligible for the LIHEAP Program in 2010. Source: 2010 American Community Survey 15
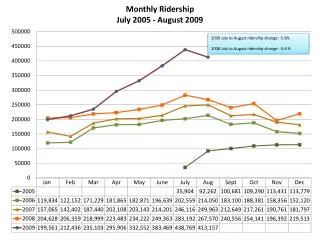
Minnesota LIHEAP and WAP Recipients in 2010 About 38% of income-eligible households received LIHEAP and 2% received WAP. National averages are 17% and 0.5%, respectively. Source: 2010 American Community Survey and 2010 MN LIHEAP/WAP Database 16
Housing Unit Type LIHEAP is less likely to serve households in Large Multi-Family buildings. WAP serves very few households in Multi-Family buildings of any type. Source: 2010 American Community Survey and 2010 MN LIHEAP/WAP Database 17
Housing Unit Type LIHEAP is less likely to serve households in Large Multi-Family buildings. WAP serves very few households in Multi-Family buildings of any type. Source: 2010 American Community Survey and 2010 MN LIHEAP/WAP Database 18
Ownership Status LIHEAP serves both owners and renters. WAP is less likely to serve renters. Source: 2010 American Community Survey and 2010 MN LIHEAP/WAP Database 19
Ownership Status – Single Family Units Even if we control for housing unit type, WAP is more likely to serve owners than renters. Source: 2010 American Community Survey and 2010 MN LIHEAP/WAP Database 20
Ownership Status of WAP Participants – Single Family Units Control for housing unit type reduces that variation in service to renters by substate area. Source: 2010 American Community Survey and 2010 MN LIHEAP/WAP Database 21
How are you serving them? Example of furnishing details for the state, region, and agency. 22
How much energy are you saving and how does that vary by important program factors? 25
Table 1WAP Energy Impacts for Single Family Site-Built HomesGross and Net Gas Savings by End Use (therms/year)
Table 3WAP Energy Impacts for Single Family Site-Built HomesGas Savings for Homes with Natural Gas Main HeatBy Measure Combination (therms/year)
Table 4WAP Energy Impacts for Single Family Site-Built HomesNet Gas Savings for Natural Gas Main Heat by Pre-Weatherization Gas Usage (therms/year)
Table 12Gas Impact Results by Agency for Gas Heated Single Family Site-Built Homes
Table 26Emissions BenefitsEstimated Value of Avoided Emissions per Home for Single Family Site-Built Homes (2013 Dollars)
Contact David Carroll, 609-252-8010 david-carroll@appriseinc.org APPRISE 32 Nassau Street, Suite 200 Princeton, NJ 08540 34