Download
1 / 24
240 likes | 413 Views
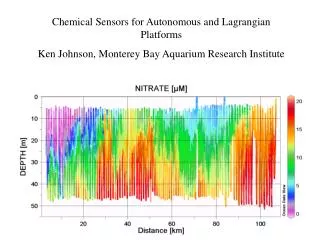
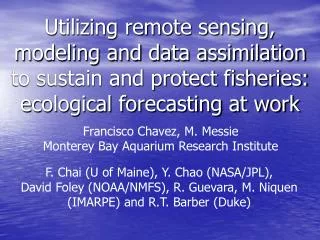
Utilizing remote sensing, modeling and data assimilation to sustain and protect fisheries: ecological forecasting at work. Francisco Chavez, M. Messie Monterey Bay Aquarium Research Institute. F. Chai (U of Maine), Y. Chao (NASA/JPL), David Foley (NOAA/NMFS), and R.T. Barber (Duke). Approach.

E N D
Utilizing remote sensing, modeling and data assimilation to sustain and protect fisheries: ecological forecasting at work Francisco Chavez, M. Messie Monterey Bay Aquarium Research Institute F. Chai (U of Maine), Y. Chao (NASA/JPL), David Foley (NOAA/NMFS), and R.T. Barber (Duke)
Approach • Develop remote sensing products for fisheries decision support systems • Develop strong theoretical basis for forecasting using in situ and satellite data • Develop 50 year model hindcasts and test theory • Develop 2-9 month model forecasts and incorporate into fisheries decision support systems
MODIS chlorophyll - first biological parameter explicitly included in the CPC report Mean trend Mean Trend Anomaly Anomaly Dave Foley, NOAA
Science at the leading and/or bleeding edge Why Peru? Long term (9 month) forecasts of chlorophyll
More fish (total and per unit primary production) than any other place in the world!
Change? SST 1880 - 2006 Two Primary States SSH 1983 – 2006 black line Varia- bility
Regional Ocean Model Systems (ROMS)-CoSiNE CoSiNE: Carbon, Silicate, and Nitrogen Ecosystem (Chai and Chao) Eddy-Resolving Ocean Model at 12-km
Pacific Basin ROMS-CoSINE (12-km) SimulationAnnual Mean Sea Surface Temperature (SST) Modeled SST (oC) Satellite SST (oC) 10
Zooplankton(ROMS-CoSINE) Averaged from 1991-2007 by ROMS-CoSINE (blended wind forcing)
SST 50 year 50 km hindcast simulation Data Model
Data Model SST Sea level
EGGS DURATION: 24 HR MORTALITY RATE>99% YOLK-SAC LARVE LEN: 2-4MM DURATION: 24-28 HR MORTALITY RATE 80%-98% AGE-2+ LIFE SPAN ~3 YR PREDATOR: SEA BIRDS, MARINE MAMMALS FIRST-FEEDER FEED BY PHYTOPL. LEN: 4.25CM, WT: ~2 gm DURATION: 80 DAYS AGE-2 LEN: ~20CM WT: ~55 gm OPT TEMP: 18.6°C SPAWN ~20 TIMES/YR AGE-1(JUVENILE) BECOME SEXUAL MATRUE LEN: 8-10CM WT: ~10 gm ROMS-CoSINE (12 km) Temperature, Currents, Plankton ROMS-CoSINE (12 km) Temperature, Currents, Plankton Life Cycle of Peruvian Anchovy Individual Based Model with ROMS-CoSINE Yi Xu, U of Maine ROMS-CoSINE (12 km) Temperature, Currents, Plankton ROMS-CoSINE (12 km) Temperature, Currents, Plankton
Anchovy Distribution Statistics • Start with same amount of eggs • Release eggs each year/month • Calculate the total survivors after 6 months with spatial distribution • Temperature and food (phyto+zoo) control survivorship
Anchovy Distribution Averaged from 1991-2007 by IBM
Next steps • Continue to improve forecasts and insert into DSS • Retrospective analysis to get at mechanisms behind changes • Clearly identified changes in the ecosystem – 1972 anchoveta decline, sardine increase, 1989 anchoveta recovery and sardine decline, 1992 humboldt squid appearance-jack mackerel/hake disappearance, 1998 appearance of cool water species