Download
1 / 6
60 likes | 134 Views
In the meantime. Varied p T cut (1.5 GeV, 1 GeV , 500 MeV) Allowed for events with 2 good tracks only (+ ), originally 4 good tracks where required, in order to fully reconstruct the B S D S () decay Enlarged angle cuts , between K + and K : 10 13 deg (see next slide)

E N D
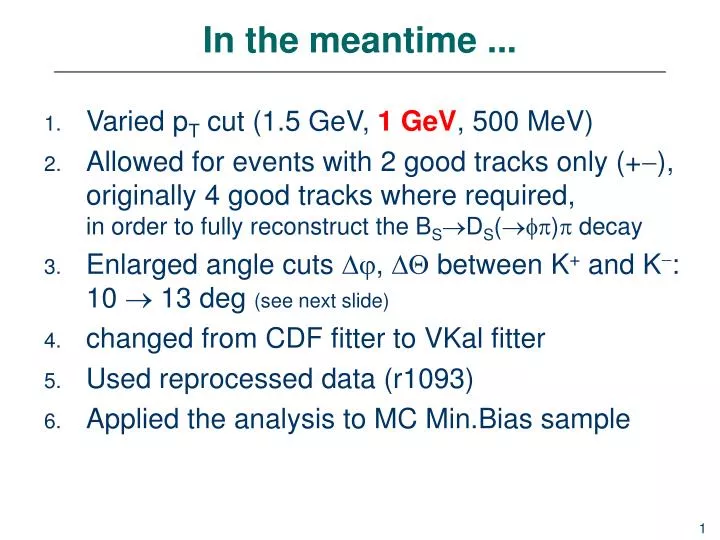
In the meantime ... • Varied pT cut (1.5 GeV, 1 GeV, 500 MeV) • Allowed for events with 2 good tracks only (+),originally 4 good tracks where required,in order to fully reconstruct the BSDS() decay • Enlarged angle cuts , between K+ and K:10 13 deg (see next slide) • changed from CDF fitter to VKal fitter • Used reprocessed data (r1093) • Applied the analysis to MC Min.Bias sample
What we presently do/plan to do last time we said: • Do background subtraction by using same sign combinations of tracks. • Find more appropriate function for describing the background shape (polynomial has stability problems with low statistics). • The fitting function for signal should better be a Breit-Wigner accounting for phase space convoluted with a Gaussian to represent the detector resolution. • Go down only to pT > 0.8 GeV, and build a phi peak again (still no dE/dx). Make a mass plot of () candidates, that build a 3-prong vertex, look at the DSmeson mass region (putting both + and candidates into one plot).
Width of the (1020) in MC truth Fitting the Monte Carlo truth signal with a Breit-Wigner (relativistic and non-relativistic) gives m = 1019.38 0.004 GeVand = 4.45 0.01 GeV, which is larger than the current PDG value investigations width [GeV] mass [GeV] • PDG 1990 4.41 1998 4.43 2006-9 4.26 1019.46 • Pythia_6.42 4.43 1019.4(current version)PMAS(KC,2) PMAS(KC,1) Conclusion: (1020) in ATLAS Monte Carlo productionsnot generated with the current PDG value for the width!
Fitting the (1020) signal • Using a convolution of a Breit-Wigner with a Gaussian (and a threshold function for the bg) • inside the RooFit framework • has already implemented this convolution: “Voigtian“ • fix width of Breit-Wigner ( = 4.26 GeV) RooVoigtian signal("signal","Voigtian PDF",x,mean,width,sigma); width.setVal(4.26); width.setConstant(kTRUE); RooGenericPdf bg("bg","background","(x-987.35)^p*exp(-b*(x-987.35))",RooArgSet(x,p,d)); RooAddPdf model("model","sum of signal and bg",RooArgList(signal,bg),RooArgList(Nsig,Nbkg)); model.fitTo(data); // Extended Maximum Likelihood Fit (unbinned) width.Print();
with first plot shown (pT > 1.5 GeV) Comparision with the old method N = 60.7 15 = 2.93 0.74 Gauss One gets 30% more events(due to tails of Breit-Wigner). N = 58 16 = 2.88 0.76 N = 76 19 Gauss = 1.8 1.0 Gauss Voigt