Download
1 / 15
150 likes | 324 Views
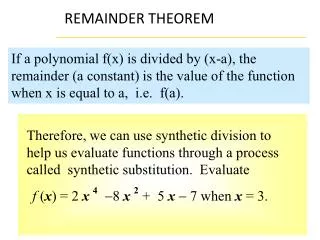
Inference About Conditional Associations In 2 x 2 x K Tables. Demeke Kasaw Gary Gongwer. An Example from §2.3. Death Penalties in Florida for Multiple Murders, 1976-1987 Odds Ratio = 1.45. Converting this to a 2 X 2 X 2 Table. We now have 2 Partial Tables, by race of the victim

E N D
Inference About Conditional Associations In 2 x 2 x K Tables Demeke Kasaw Gary Gongwer
An Example from §2.3 Death Penalties in Florida for Multiple Murders, 1976-1987 Odds Ratio = 1.45
Converting this to a 2 X 2 X 2 Table We now have 2 Partial Tables, by race of the victim Conditional Odds Ratios:
This can be generalized to K different levels To study whether an association exists between an explanatory and response variable after controlling for a possibly confounding variable • Different medical centers • Severity of Condition • Age • Different Studies of the same sort (Meta Analysis)
Using logit Models to Test Independence We wish to estimate the conditional probabilities If Y depends on X, then If Y and X are independent
Estimation of Common Odds Ratio When the association seems stable among the partial tables, it is helpful to combine the K odds ratios into a summary measure of conditional association.
Testing Homogeneity of Odds Ratios Ha: At least one is different
SAS CODES data cmh; input center $ treat response count ; datalines; a 1 1 11 a 1 2 25 a 2 1 10 h 2 2 1 ; /*Consider 2x2xk*/ procfreq data = cmh; weight count; tables center*treat*response / cmh chisq All; run; /*Consider 2x2*/ procfreq data = cmh; weight count; tables treat*response / cmh chisq All; run;
Partial outputs Odds Ratio for calculated on each centers; for center 1 Estimates of the Relative Risk (Row1/Row2) Type of Study Value 95% Confidence Limits Case-Control (Odds Ratio) 1.1880 0.4307 3.2766 Center 2 Estimates of the Relative Risk (Row1/Row2) Type of Study Value 95% Confidence Limits Case-Control (Odds Ratio) 1.8182 0.4826 6.8496 Center 3 Estimates of the Relative Risk (Row1/Row2) Type of Study Value 95% Confidence Limits Case-Control (Odds Ratio) 4.8000 1.2044 19.1292
Table 5 of treat by response • Controlling for center=e • treat response • Frequency‚ • Percent ‚ • Row Pct ‚ • Col Pct ‚ 1‚ 2‚ Total • ƒƒƒƒƒƒƒƒƒˆƒƒƒƒƒƒƒƒˆƒƒƒƒƒƒƒƒˆ • 1 ‚ 6 ‚ 11 ‚ 17 • ‚ 20.69 ‚ 37.93 ‚ 58.62 • ‚ 35.29 ‚ 64.71 ‚ • ‚ 100.00 ‚ 47.83 ‚ • ƒƒƒƒƒƒƒƒƒˆƒƒƒƒƒƒƒƒˆƒƒƒƒƒƒƒƒˆ • 2 ‚ 0 ‚ 12 ‚ 12 • ‚ 0.00 ‚ 41.38 ‚ 41.38 • ‚ 0.00 ‚ 100.00 ‚ • ‚ 0.00 ‚ 52.17 ‚ • ƒƒƒƒƒƒƒƒƒˆƒƒƒƒƒƒƒƒˆƒƒƒƒƒƒƒƒˆ • Total 6 23 29 • 20.69 79.31 100.00 Table 6 of treat by response Controlling for center=f treat response Frequency‚ Percent ‚ Row Pct ‚ Col Pct ‚ 1‚ 2‚ Total ƒƒƒƒƒƒƒƒƒˆƒƒƒƒƒƒƒƒˆƒƒƒƒƒƒƒƒˆ 1 ‚ 1 ‚ 10 ‚ 11 ‚ 4.76 ‚ 47.62 ‚ 52.38 ‚ 9.09 ‚ 90.91 ‚ ‚ 100.00 ‚ 50.00 ‚ ƒƒƒƒƒƒƒƒƒˆƒƒƒƒƒƒƒƒˆƒƒƒƒƒƒƒƒˆ 2 ‚ 0 ‚ 10 ‚ 10 ‚ 0.00 ‚ 47.62 ‚ 47.62 ‚ 0.00 ‚ 100.00 ‚ ‚ 0.00 ‚ 50.00 ‚ ƒƒƒƒƒƒƒƒƒˆƒƒƒƒƒƒƒƒˆƒƒƒƒƒƒƒƒˆ Total 1 20 21 4.76 95.24 100.00
Center 7 Estimates of the Relative Risk (Row1/Row2) Type of Study Value 95% Confidence Limits ---------------------------------------------------------------------------------------------------------------------- Case-Control (Odds Ratio) 2.0000 0.0976 41.0034 Center 8 Estimates of the Relative Risk (Row1/Row2) Type of Study Value 95% Confidence Limits ---------------------------------------------------------------------------------------------------------------------- Case-Control (Odds Ratio) 0.3333 0.0221 5.0271 Total Type of Study Method Value 95% Confidence Limits --------------------------------------------------------------------------------------------------------------------------- Case-Control Mantel-Haenszel 2.1345 1.1776 3.8692 (Odds Ratio) Logit ** 1.9497 1.0574 3.5949 Estimates of the Common Relative Risk (Row1/Row2) Type of Study Method Value 95% Confidence Limits --------------------------------------------------------------------------------------------------------------------------- Case-Control Mantel-Haenszel 1.4979 0.9151 2.4518 (Odds Ratio) Logit 1.4979 0.9151 2.4518 Homogeneity test: Breslow-Day Test for Homogeneity of the Odds Ratios ƒƒƒƒƒƒƒƒƒƒƒƒƒƒƒƒƒƒƒƒƒƒƒƒƒƒƒƒƒƒ Chi-Square 7.9955 DF 7 Pr > ChiSq 0.3330 Total Sample Size = 273
Thank you • Good luck with Prof. Trumbo’s Exam