Download
1 / 40
400 likes | 506 Views
Particles Competition and Cooperation in Networks for Semi-Supervised Learning. Fabricio Breve Department of Electrical & Computer Engineering University of Alberta Seminar - October 09, 2009. Contents. Introduction Semi-Supervised Learning Model Description Initial Configuration

E N D
Particles Competition and Cooperation in Networks for Semi-Supervised Learning FabricioBreve Department of Electrical & Computer Engineering University of Alberta Seminar - October 09, 2009
Contents • Introduction • Semi-Supervised Learning • Model Description • Initial Configuration • Node and Particle Dynamics • Random-Deterministic Walk • Algorithm • Computer Simulations • Synthetic Data Sets • Real-World Data Sets • Fuzzy Output and Outlier Detection • Conclusions
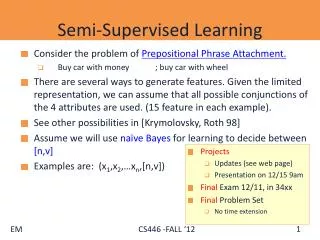
Introduction • Data sets under processing are becoming larger • In many situations only a small subset of items can be effectively labeled • Labeling process is often: • Expensive • Time consuming • Requires intensive human involvement
Introduction • Supervised Learning • Only labeled data items are used for training • Unsupervised Learning • All data items are unlabeled • Semi-Supervised Learning • Combines a few labeled data items with a large number of unlabeled data to produce betters classifiers
X. Zhu, “Semi-supervised learning literature survey,” Computer Sciences, University of Wisconsin-Madison, Tech. Rep. 1530, 2005.
Semi-Supervised Learning:Graph-Based Methods • X. Zhu, Z. Ghahramani, and J. Lafferty, “Semi-supervised learning using gaussian fields and harmonic functions,” in Proceedings of the Twentieth International Conference on Machine Learning, 2003, pp. 912–919. • D. Zhou, O. Bousquet, T. N. Lal, J. Weston, and B. Schölkopf, “Learning with local and global consistency,” in Advances in Neural Information Processing Systems, vol. 16. MIT Press, 2004, pp. 321–328. [Online]. Available: http://www.kyb.tuebingen.mpg.de/bs/people/weston/localglobal.pdf • X. Zhu and Z. Ghahramani, “Learning from labeled and unlabeled data with label propagation,” Carnegie Mellon University, Pittsburgh, Tech. Rep. CMU-CALD-02-107, 2002. [Online]. Available: http://citeseer.ist.psu.edu/581346.html • F. Wang and C. Zhang, “Label propagation through linear neighborhoods,” IEEE Transactions on Knowledge and Data Engineering, vol. 20, no. 1, pp. 55–67, Jan. 2008. • A. Blum and S. Chawla, “Learning from labeled and unlabeled data using graph mincuts,” in Proceedings of the Eighteenth International Conference on Machine Learning. San Francisco: Morgan Kaufmann, 2001, pp. 19–26. • M. Belkin, I. Matveeva, and P. Niyogi, “Regularization and semisupervised learning on large graphs,” in Conference on Learning Theory. Springer, 2004, pp. 624–638. • M. Belkin, N. P., and V. Sindhwani, “On manifold regularization,” in Proceedings of the Tenth International Workshop on Artificial Intelligence and Statistics (AISTAT 2005). New Jersey: Society for Artificial Intelligence and Statistics, 2005, pp. 17–24. • T. Joachims, “Transductive learning via spectral graph partitioning,” in Proceedings of International Conference on Machine Learning. AAAI Press, 2003, pp. 290–297.
Graph-Based Methods • Advantage of identifying many different class distributions • Most of them share the regularization framework, differing only in the particular choice of the loss function and the regularizer • Most of them have high order of computational complexity (O(n3)), making their applicability limited to small or middle size data sets. X. Zhu, “Semi-supervised learning literature survey,” Computer Sciences, University of Wisconsin-Madison, Tech. Rep. 1530, 2005.
ParticleCompetition • M. G. Quiles, L. Zhao, R. L. Alonso, and R. A. F. Romero, “Particle competition for complex network community detection,” Chaos, vol. 18, no. 3, p. 033107, 2008. [Online]. Available: http://link.aip.org/link/?CHAOEH/18/033107/1 • Particles walk in the network and compete with each other in such a way that each of them tries to possess as many nodes as possible. • Each particle prevents other particles to invade its territory. • Finally, each particle is confined inside a network community.
Illustration of the community detection process by competitive particle walking. The total number if nodes is N=128, the number of communities is M=4. The proportion of out links is zout / k=0.2, and the average node degree is k=16. (a) Initial configuration. Four particles, represented by yellow the lightest gray, cyan the second lightest gray, orange the third lightest gray, and blue the second darkest gray, are randomly put in the network. Red the darkest gray represents free nodes. (b) A snapshot at iteration 250. (c) A snapshot at iteration 3500. (d) A snapshot at iteration 7000.
Proposed Method • Particles competition and cooperation in networks • Competition for possession of nodes of the network • Cooperation among particles from the same team (label) • Each team of particles tries to dominate as many nodes as possible in a cooperative way and at the same time prevent intrusion of particles of other teams. • Random-deterministic walk
InitialConfiguration • A particle is generated for each labeled node of the network • Particle’s home node • Particles with same label play for the same team • Nodes have an ownership vector • Labeled nodes have ownership set to their respective teams. • Ex: [ 1 0 0 0 ] (4 classes, node labeled as class A) • Unlabeled nodes have levels set equally for each team • Ex: [ 0.25 0.25 0.25 0.25 ] (4 classes, unlabeled node) • Particles initial position is set to their respective home nodes.
Node and Particle Dynamics • Node Dynamics • When a particle selects a neighbor to visit: • It decreases the domination level of the other teams in this same node • It increases the domination level of its team in the target node • Exception: • Labeled nodes domination levels are fixed t t+1
Node and Particle Dynamics • Particle Dynamics • A particle will get: • stronger when it is targeting a node being dominated by its team • weaker when it is targeting a node dominated by other teams
Node and Particle Dynamics • Distance table • Keep the particle aware of how far it is from its home node • Prevents the particle from losing all its strength when walking into enemies neighborhoods • Keep them around to protect their own neighborhood. • Updated dynamically with local information • Does not require any prior calculation 0 1 1 2 4 2 3 3 4 ? 4
Particles Walk • Shocks • A particle really visits a target node only if the domination level of its team is higher than others; • otherwise, a shock happens and the particle stays at the current node until next iteration. • How a particle chooses a neighbor node to target? • Random walk • Deterministic walk
Random-deterministic walk • Random walk • The particle randomly chooses any neighbor to visit with no concern about domination levels or distance • Deterministic walk • The particle will prefer visiting nodes that its team already dominates and nodes that are closer to their home nodes The particles must exhibit both movements in order to achieve an equilibrium between exploratory and defensive behavior
Deterministic Moving Probabilities v4 v2 v2 v3 Random Moving Probabilities v1 v3 v4 v2 v4 v3
Algorithm • Build the adjacency matrix, • Set nodes domination levels, • Set initial positions of particles at their corresponding home nodes. Set particle strength and distance, • Repeat steps 5 to 9 until convergence or until a predefined number of steps has been achieved, • For each particle, complete steps 6 to 9, • Select the target node by using the combined random-deterministic rule, • Update target node domination levels, • Update particle strength, • Update particle distance table, • Label each unlabeled data item by the team of maximum level of domination.
Computer Simulations SYNTHETIC DATA SETS
Fig. 1. Classification of the banana-shaped patterns. (a) toy data set with 2; 000 samples divided in two classes, 20 samples are pre-labeled (red circles and blue squares). (b) classification achieved by the proposed algorithm.
Fig. 3. Time series for different values of pdet: (a) correct detection rate (b) nodes’ maximum domination level (c) average particle strength. Each point is the average of 200 realizations using a banana-shaped toy data set
Computer Simulations Real-world data sets
Fuzzy Output and Outlier Detection • There are common cases where some nodes in a network can belong to more than one community • Example: In a social network of friendship, individuals often belong to several communities: their families, their colleagues, their classmates, etc • These are called overlap nodes • Most known community detection algorithms do not have a mechanism to detect them
Fuzzy Output and Outlier Detection • Particle’s standard algorithm • Final ownership levels define nodes labels • Very volatile under certain conditions • In overlap nodes the dominating team changes frequently • Levels do not correspond to overlap measures • Particle’s modified algorithm • New variable: temporal averaged domination level for each team at each node • Weighted by particle strength • Considers only the random movements • Now the champion is not the team who have won the last games, but rather the team who have won more games in the whole championship
Fig. 9. Fuzzy classification of two banana-shaped classes generated with different variance parameters: (a) s = 0.6 (b) s = 0.8 (c) s = 1.0. Nodes size and colors represent their respective overlap index detected by the proposed method.
Fig. 9. Fuzzy classification of two banana-shaped classes generated with different variance parameters: (a) s = 0.6 (b) s = 0.8 (c) s = 1.0. Nodes size and colors represent their respective overlap index detected by the proposed method.
Fig. 9. Fuzzy classification of two banana-shaped classes generated with different variance parameters: (a) s = 0.6 (b) s = 0.8 (c) s = 1.0. Nodes size and colors represent their respective overlap index detected by the proposed method.
Fig. 10. Classification of normally distributed classes (Gaussian distribution). (a) toy data set with 1,000 samples divided in four classes, 20 samples are labeled, 5 from each class (red squares, blue triangles, green lozenges and purple stars). (b) nodes size and colors represent their respective overlap index detected by the proposed method.
Fig. 10. Classification of normally distributed classes (Gaussian distribution). (a) toy data set with 1,000 samples divided in four classes, 20 samples are labeled, 5 from each class (red squares, blue triangles, green lozenges and purple stars). (b) nodes size and colors represent their respective overlap index detected by the proposed method.
Fig. 11. Comparative between the standard and the modified models: (a) artificial data set with some wrongly labeled nodes (b) classification by the standard particles method (c) classification by the modified particles method
Fig. 11. Comparative between the standard and the modified models: (a) artificial data set with some wrongly labeled nodes (b) classification by the standard particles method (c) classification by the modified particles method
Fig. 11. Comparative between the standard and the modified models: (a) artificial data set with some wrongly labeled nodes (b) classification by the standard particles method (c) classification by the modified particles method
Fig. 12. The karate club network. Nodes size and colors represent their respective overlap index detected by the proposedmethod.
Conclusions • The main contributions of the proposed model can be outlined in the following way: • unlike most other graph-based models, it does not rely on loss functions or regularizers; • it can classify data with many different distribution, including linearly non-separable data; • it has a lower order of complexity than other graph-based models, thus it can be used to classify large data sets; • it can achieve better classification rate than other classical graph-based methods; • it can detect overlap nodes and provide a fuzzy output for each of them; • it can be used to detect outliers and, consequently, to stop error propagation.