Download
1 / 38
380 likes | 519 Views
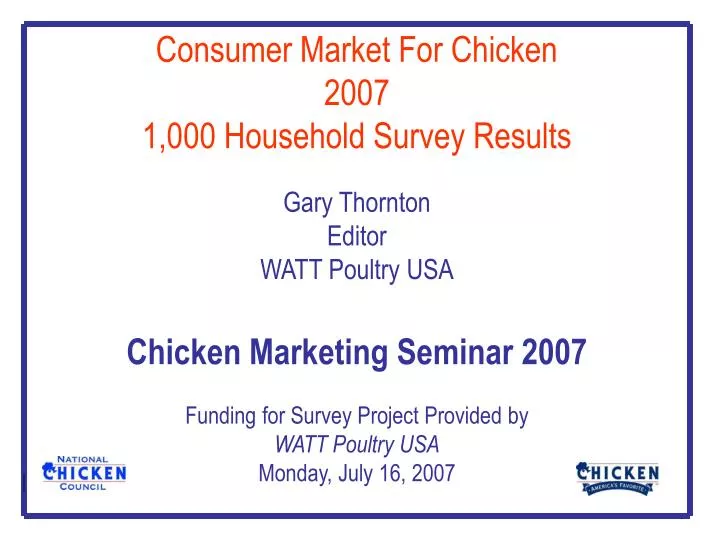
Consumer Market For Chicken 2007 1,000 Household Survey Results Gary Thornton Editor WATT Poultry USA Chicken Marketing Seminar 2007 Funding for Survey Project Provided by WATT Poultry USA Monday, July 16, 2007. Purpose To Determine.

E N D
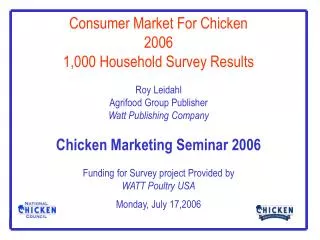
Consumer Market For Chicken 2007 1,000 Household Survey Results Gary Thornton Editor WATT Poultry USA Chicken Marketing Seminar 2007 Funding for Survey Project Provided by WATT Poultry USA Monday, July 16, 2007
Purpose To Determine... • Frequency and market penetration of eating chicken at-home, away-from-home, and combined. • Frequency of eating chicken by light, medium, and heavy consumers of chicken. • Consumers who purchase rotisserie chickens and frequency of purchase • Consumption of dark meat chicken parts such as legs, thighs, and drumsticks.
Survey Facts • Survey was conducted by PKS Research Partners • 1,004 household interviews were conducted via telephone June 8-10, 2007 • Respondents 18 years of age and older • 516 females • 484 males • Part of an omnibus survey of randomly selected telephone numbers
Survey Facts • Respondents’ numbers are on a weighted basis • 679 respondents are primary grocery shoppers • 70 respondents share primary grocery shopping with someone else • 245 responses are from household members who do not have responsibility for grocery food shopping.
Survey Facts Regional Distribution of Respondents (weighted): Region Percent New England 5 Mid Atlantic 14 East North Central 15 West North Central 8 South Atlantic 20 East South Central 7 West South Central 9 Mountain 6 Pacific 16 US Total 100
Survey Facts Race of Respondents (weighted) Percent Race
Question1 • Thinking about the meals and snacks you’ve eaten in the past two weeks, how many times did you eat chicken that was purchased from a supermarket or other retail grocery store? (Fresh, frozen, or prepared chicken are included in the responses.)
Question 2 • Thinking about the meals and snacks you’ve eaten in the past two weeks, how many times did you eat chicken that was purchased at a restaurant, fast food store, carryout shop or employee cafeteria? (Prepared meals of chicken, chicken products/sandwiches, and similar foodservice chicken items are included in the responses.)
Frequency of Eating Chicken Purchased from Retail Grocery and Foodservice, 2001-2007 01 02 03 04 05 06 07 01 02 03 04 05 06 07 Average Times During Two Week Time Period Note: Frequency includes all respondents whether they ate chicken or not during the two week time period.
Combined Frequency of Eating Chicken 2001200220032004200520062007 ---------------------------Average times in two weeks-------------------------- Supermarket/Grocery Store 2.4 3.1 2.9 3.1 3.1 3.3 2.7 Restaurant/ Foodservice 1.7 1.8 2.0 2.0 2.0 1.9 1.8 Total 4.1 4.9 4.9 5.1 5.1 5.2 4.5 Note: Frequency includes all respondents whether they ate chicken or not during the two week time period
Frequency of Eating Chicken Purchased from Retail Grocery and Foodservice (combined) 2001-2007 Note: Combined frequency includes all respondents whether they ate chicken or not during two week time period.
Share of Consumers Eating Chicken Purchased From Retail Grocery During Two Week Time Period 2001-2007 Percent
Share of Consumers Eating Chicken Purchased From Foodservice During Two Week Time Period 2001-2007 Percent
Share of Consumers Eating Chicken Purchased From Retail Grocery and Foodservice (combined) During Two Week Time Period 2001-2007 Percent
Frequency of Eating Chicken That Was Purchased at Supermarket/Retail Grocery (Times During Past Two Weeks/2007) Light None Average times including none: 2.7 Average times excluding none: 3.3 1 percent didn’t know/didn’t respond
Frequency of Eating Chicken That Was Purchased at Supermarket/Retail Grocery (Times During Past Two Weeks/2007) Medium Light None Average times including none: 2.7 Average times excluding none: 3.3 1 percent didn’t know/didn’t respond
Frequency of Eating Chicken That Was Purchased at Supermarket/Retail Grocery (Times During Past Two Weeks/2007) Medium Light None Heavy Average times including none: 2.7 Average times excluding none: 3.3 1 percent didn’t know/didn’t respond
Frequency of Eating Chicken Purchased from Foodservice(Times During Two Weeks/2007) None Light Frequency Average times including none: 1.8 Average times excluding none: 2.8 1 percent didn’t know/didn’t respond
Frequency of Eating Chicken Purchased from Foodservice(Times During Two Weeks/2007) None Light Medium Frequency Average times including none: 1.8 Average times excluding none: 2.8 1 percent didn’t know/didn’t respond
Frequency of Eating Chicken Purchased from Foodservice(Times During Two Weeks/2007) None Light Medium Heavy Frequency Average times including none: 1.8 Average times excluding none: 2.8 1 percent didn’t know/didn’t respond
Responses for Eating Chicken from Retail Grocery and Foodservice Combined(Times During Two Weeks/2007) Light None Average times including none: 4.5 Average times excluding none: 4.9
Responses for Eating Chicken from Retail Grocery and Foodservice Combined (Times During Two Weeks/2007) Medium Light None Average times including none: 4.5 Average times excluding none: 4.9
Responses for Eating Chicken from Retail Grocery and Foodservice Combined (Times During Two Weeks/2007) Heavy Medium Light None Average times including none: 4.5 Average times excluding none: 4.9
Chicken Consumption Summary • Nine of ten people surveyed had consumed chicken in the two weeks prior to the survey (meal or snack). • Average of 4.5 times when all respondents are combined. • More than eight of ten surveyed had consumed chicken purchased from a supermarket/ grocery store. • About two-thirds of survey respondents had consumed chicken from some foodservice establishment in 2007.
Question 3a • Thinking of the past four weeks, how many times have you purchased a rotisserie chicken? • Number from supermarket or grocery store • Number from carryout restaurant or similar foodservice outlet Question 3b • What was your primary reason for buying a rotisserie chicken? (responses were unaided with up to three different responses accepted from an individual respondent).
Households Purchasing Rotisserie Chicken from Supermarket, Takeout Restaurant, or Similar Foodservice Outlet During the Past Four Weeks. (2007) Purchased ? Percent of Respondents
Place of Purchase for Rotisserie Chicken Average Purchased Outlet Percent
Frequency of Purchasing Rotisserie Chicken at Supermarket or Foodservice Combined Light Medium Heavy Average excluding none: 2.7 Average including none: 2.7 2 percent didn’t know/didn’t respond
Primary Reason for Buying a Rotisserie Chicken Reason Percent 29 28 20 9 7 4 4 3 3 1 1 16 3
Primary Reason for Buying a Rotisserie Chicken Didn’t know/Didn’t Respond – 3%
Rotisserie Summary • Nearly one of four (23 percent) of the people surveyed purchased rotisserie chicken. • Average of 2.7 rotisserie chickens purchased over four week period, when just the purchasers of rotisserie chicken are considered. • Race of consumers purchasing rotisserie chicken are as follows (times in four weeks): Black 3.8, Hispanic 3.1, White 2.3, and other 2.5. • Regions with the highest frequency of rotisserie chicken purchases were as follows (times in four weeks): East North Central 4.0 and Mid-Atlantic 3.2.
Question 5 • Thinking about the last four weeks how often did you eat dark meat chicken parts (like legs, thighs, and drumsticks) either at home or away from home?
Frequency of Eating Dark Meat Chicken Parts (Four week period/2007) None Light Medium Heavy Average excluding none: 3.2 Average including none: 1.8 1 percent didn’t know/didn’t respond
Question 6 • Which of the following best describes reason why you might eat dark meat chicken parts such as legs, thighs, or drumsticks more often?
Would eat more dark meat parts more often if… Reason Percent 41 34 33 32 28 18 17 12 19 6
Would eat more dark meat parts if… Wouldn’t eat dark meat – 19% Didn’t know/Didn’t Respond – 6%
Dark Meat Summary • Over half (55 percent) of those surveyed said they consumed dark meat parts in the past month. • Dark meat was eaten 1.8 times on average in the past month of survey when all respondents are included. • Black and Hispanic consumers ate dark meat more frequently, 2.5 times and 2.0 times, respectively, in four weeks. • Top regional dark meat consumers were West South Central 2.3 times and East South Central 2.2 times.
For more information about the 2007 survey results, contact the National Chicken Council. A print out of the survey is available via e-mail upon request. Contact Bill Roenigk at wroenigk@chickenusa.org / (202) 296-2622 National Chicken Council 1015 15th St NW, Suite 930Washington DC 20005tel (202) 296-2622fax (202) 293-4005www.nationalchickencouncil.com