Download
1 / 59
590 likes | 977 Views
Lecture 2: Data Mining. Roadmap. What is data mining? Data Mining Tasks Classification/Decision Tree Clustering Association Mining Data Mining Algorithms Decision Tree Construction Frequent 2-itemsets Frequent Itemsets (Apriori) Clustering/Collaborative Filtering. What is Data Mining?.

E N D
Roadmap • What is data mining? • Data Mining Tasks • Classification/Decision Tree • Clustering • Association Mining • Data Mining Algorithms • Decision Tree Construction • Frequent 2-itemsets • Frequent Itemsets (Apriori) • Clustering/Collaborative Filtering
What is Data Mining? • Discovery of useful, possibly unexpected, patterns in data. • Subsidiary issues: • Data cleansing: detection of bogus data. • E.g., age = 150. • Visualization: something better than megabyte files of output. • Warehousing of data (for retrieval).
Typical Kinds of Patterns • Decision trees: succinct ways to classify by testing properties. • Clusters: another succinct classification by similarity of properties. • Bayes, hidden-Markov, and other statistical models, frequent-itemsets: expose important associations within data.
Example: Clusters x xx x x x x x x x x x x x x x x x x x x x x x x x x x x x x x x x x x x x x x x
Applications (Among Many) • Intelligence-gathering. • Total Information Awareness. • Web Analysis. • PageRank. • Marketing. • Run a sale on diapers; raise the price of beer. • Detective?
Cultures • Databases: concentrate on large-scale (non-main-memory) data. • AI (machine-learning): concentrate on complex methods, small data. • Statistics: concentrate on inferring models.
Models vs. Analytic Processing • To a database person, data-mining is a powerful form of analytic processing --- queries that examine large amounts of data. • Result is the data that answers the query. • To a statistician, data-mining is the inference of models. • Result is the parameters of the model.
Meaningfulness of Answers • A big risk when data mining is that you will “discover” patterns that are meaningless. • Statisticians call it Bonferroni’s principle: (roughly) if you look in more places for interesting patterns than your amount of data will support, you are bound to find crap.
Examples • A big objection to TIA was that it was looking for so many vague connections that it was sure to find things that were bogus and thus violate innocents’ privacy. • The Rhine Paradox: a great example of how not to conduct scientific research.
Rhine Paradox --- (1) • David Rhine was a parapsychologist in the 1950’s who hypothesized that some people had Extra-Sensory Perception. • He devised an experiment where subjects were asked to guess 10 hidden cards --- red or blue. • He discovered that almost 1 in 1000 had ESP --- they were able to get all 10 right!
Rhine Paradox --- (2) • He told these people they had ESP and called them in for another test of the same type. • Alas, he discovered that almost all of them had lost their ESP. • What did he conclude? • Answer on next slide.
Rhine Paradox --- (3) • He concluded that you shouldn’t tell people they have ESP; it causes them to lose it.
Data Mining Tasks • Data mining is the process of semi-automatically analyzing large databases to find useful patterns • Prediction based on past history • Predict if a credit card applicant poses a good credit risk, based on some attributes (income, job type, age, ..) and past history • Predict if a pattern of phone calling card usage is likely to be fraudulent • Some examples of prediction mechanisms: • Classification • Given a new item whose class is unknown, predict to which class it belongs • Regression formulae • Given a set of mappings for an unknown function, predict the function result for a new parameter value
Data Mining (Cont.) • Descriptive Patterns • Associations • Find books that are often bought by “similar” customers. If a new such customer buys one such book, suggest the others too. • Associations may be used as a first step in detecting causation • E.g. association between exposure to chemical X and cancer, • Clusters • E.g. typhoid cases were clustered in an area surrounding a contaminated well • Detection of clusters remains important in detecting epidemics
Decision Trees • Example: • Conducted survey to see what customers were interested in new model car • Want to select customers for advertising campaign training set
One Possibility age<30 Y N city=sf car=van Y Y N N likely unlikely likely unlikely
Another Possibility car=taurus Y N city=sf age<45 Y Y N N likely unlikely likely unlikely
Issues • Decision tree cannot be “too deep” • would not have statistically significant amounts of data for lower decisions • Need to select tree that most reliably predicts outcomes
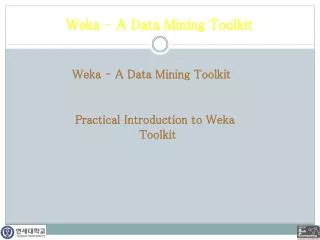
Clustering income education age
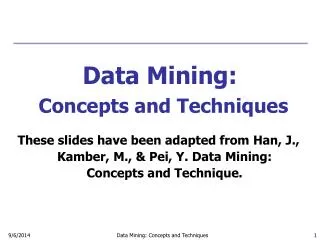
Another Example: Text • Each document is a vector • e.g., <100110...> contains words 1,4,5,... • Clusters contain “similar” documents • Useful for understanding, searching documents sports international news business
Issues • Given desired number of clusters? • Finding “best” clusters • Are clusters semantically meaningful?
Association Rule Mining transaction id products bought customer id sales records: market-basket data • Trend: Products p5, p8 often bough together • Trend: Customer 12 likes product p9
Association Rule • Rule: {p1, p3, p8} • Support: number of baskets where these products appear • High-support set: support threshold s • Problem: find all high support sets
Finding High-Support Pairs • Baskets(basket, item) • SELECT I.item, J.item, COUNT(I.basket)FROM Baskets I, Baskets JWHERE I.basket = J.basket AND I.item < J.itemGROUP BY I.item, J.itemHAVING COUNT(I.basket) >= s;
check if count s Example
Issues • Performance for size 2 rules even bigger! big • Performance for size k rules
Roadmap • What is data mining? • Data Mining Tasks • Classification/Decision Tree • Clustering • Association Mining • Data Mining Algorithms • Decision Tree Construction • Frequent 2-itemsets • Frequent Itemsets (Apriori) • Clustering/Collaborative Filtering
Classification rules help assign new objects to classes. E.g., given a new automobile insurance applicant, should he or she be classified as low risk, medium risk or high risk? Classification rules for above example could use a variety of data, such as educational level, salary, age, etc. person P, P.degree = masters and P.income > 75,000 P.credit = excellent person P, P.degree = bachelors and (P.income 25,000 and P.income 75,000) P.credit = good Rules are not necessarily exact: there may be some misclassifications Classification rules can be shown compactly as a decision tree. Classification Rules
Decision Tree Construction Employed Root Yes No Class=Not Default Node Balance >=50K <50K Class=Yes Default Age Leaf <45 >=45 Class=Not Default Class=Yes Default
Training set: a data sample in which the classification is already known. Greedy top down generation of decision trees. Each internal node of the tree partitions the data into groups based on a partitioning attribute, and a partitioning condition for the node Leaf node: all (or most) of the items at the node belong to the same class, or all attributes have been considered, and no further partitioning is possible. Construction of Decision Trees
Finding the Best Split Point for Numerical Attributes The data comes from a IBM Quest synthetic dataset for function 0 Best Split Point In-core algorithms, such as C4.5, will just online sort the numerical attributes!
Pick best attributes and conditions on which to partition The purity of a set S of training instances can be measured quantitatively in several ways. Notation: number of classes = k, number of instances = |S|, fraction of instances in class i = pi. The Gini measure of purity is defined as Gini (S) = 1 - When all instances are in a single class, the Gini value is 0 It reaches its maximum (of 1 –1 /k) if each class the same number of instances. k p2i i- 1 Best Splits
r |Si| |S| purity (Si) pilog2 pi k i= 1 i- 1 Best Splits (Cont.) • Another measure of purity is the entropy measure, which is defined as entropy (S) = – • When a set S is split into multiple sets Si, I=1, 2, …, r, we can measure the purity of the resultant set of sets as: purity(S1, S2, ….., Sr) = • The information gain due to particular split of S into Si, i = 1, 2, …., r Information-gain (S, {S1, S2, …., Sr) = purity(S ) – purity (S1, S2, … Sr)
Finding Best Splits • Categorical attributes (with no meaningful order): • Multi-way split, one child for each value • Binary split: try all possible breakup of values into two sets, and pick the best • Continuous-valued attributes (can be sorted in a meaningful order) • Binary split: • Sort values, try each as a split point • E.g. if values are 1, 10, 15, 25, split at 1, 10, 15 • Pick the value that gives best split • Multi-way split: • A series of binary splits on the same attribute has roughly equivalent effect
Procedure GrowTree (S )Partition (S );Procedure Partition (S)if ( purity (S ) > p or |S| < s ) thenreturn;for each attribute A evaluate splits on attribute A; Use best split found (across all attributes) to partitionS into S1, S2, …., Sr,for i = 1, 2, ….., r Partition (Si ); Decision-Tree Construction Algorithm
We are generally only interested in association rules with reasonably high support (e.g. support of 2% or greater) Naïve algorithm Consider all possible sets of relevant items. For each set find its support (i.e. count how many transactions purchase all items in the set). Large itemsets: sets with sufficiently high support Finding Association Rules
Example: Association Rules • How do we perform rule mining efficiently? • Observation: If set X has support t, then each X subset must have at least support t • For 2-sets: • if we need support s for {i, j} • then each i, j must appear in at least s baskets
Algorithm for 2-Sets (1) Find OK products • those appearing in s or more baskets (2) Find high-support pairs using only OK products
Algorithm for 2-Sets • INSERT INTO okBaskets(basket, item) SELECT basket, item FROM Baskets GROUP BY item HAVING COUNT(basket) >= s; • Perform mining on okBasketsSELECT I.item, J.item, COUNT(I.basket) FROM okBaskets I, okBaskets J WHERE I.basket = J.basket AND I.item < J.item GROUP BY I.item, J.item HAVING COUNT(I.basket) >= s;
count & remove sort Counting Efficiently • One way: threshold = 3
scan & count remove keep counter array in memory Counting Efficiently • Another way: threshold = 3
(1) scan & hash & count in-memory hash table in-memory counters (4) remove (2) scan & remove (3) scan& count Yet Another Way threshold = 3 false positive
frequency threshold item-pairs ranked by frequency Discussion • Hashing scheme: 2 (or 3) scans of data • Sorting scheme: requires a sort! • Hashing works well if few high-support pairs and many low-support ones iceberg queries
Frequent Itemsets Mining • Desired frequency 50% (support level) • {A},{B},{C},{A,B}, {A,C} • Down-closure (apriori) property • If an itemset is frequent, all of its subset must also be frequent
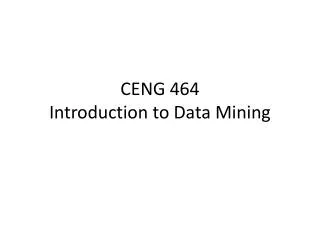
Lattice for Enumerating Frequent Itemsets Found to be Infrequent Pruned supersets
Apriori L0= C1= { 1-item subsets of all the transactions } For ( k=1; Ck 0; k++ ) { * support counting * } for all transactions t D for all k-subsets s of t if k Ck s.count++ { * candidates generation * } Lk = { c Ck | c.count>= min sup } Ck+1 = apriori_gen( Lk ) Answer = UkLk
Clustering • Clustering: Intuitively, finding clusters of points in the given data such that similar points lie in the same cluster • Can be formalized using distance metrics in several ways • Group points into k sets (for a given k) such that the average distance of points from the centroid of their assigned group is minimized • Centroid: point defined by taking average of coordinates in each dimension. • Another metric: minimize average distance between every pair of points in a cluster • Has been studied extensively in statistics, but on small data sets • Data mining systems aim at clustering techniques that can handle very large data sets • E.g. the Birch clustering algorithm!