Download
1 / 34
340 likes | 519 Views
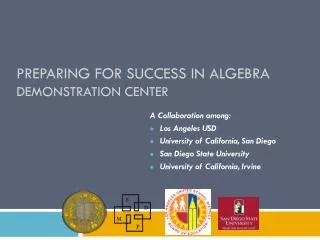
Preparing for Success in Algebra English Language Learners in Mathematics. A Collaboration among: LAUSD Local District 6 UC San Diego San Diego State University UC Irvine. Partners. LAUSD Local District 6 UC San Diego San Diego State University UC Irvine. Who's Who?.

E N D
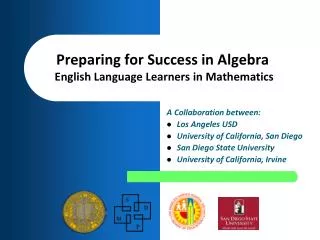
Preparing for Success in AlgebraEnglish Language Learners in Mathematics A Collaboration among: LAUSD Local District 6 UC San Diego San Diego State University UC Irvine
Partners LAUSD Local District 6 UC San Diego San Diego State University UC Irvine
Who's Who? • Grant Project Director – Open (Local District 6) • LD6 Transition Leadership Team – Sharon Sweet, Suyen Moncada-Machado, Stephanie Flaxbeard, Brian Olona, Josie Pajon • UCSD: • Gretchen Laue, Director • Dolly Casco, Associate Director • Stephan Bera • SDSU: • Dr. Rafaela Santa Cruz • Dr. John Elwin • UCI – Robin Scarcella, Researcher
What does the data tell us? • In 2007-2008 • Grade 5 45% Proficient or Advanced • Grade 6 27% Proficient or Advanced • Grade 7 23% Proficient or Advanced • Grade 8 9% Proficient or Advanced • Algebra • Grade 7 44% Proficient or Advanced • Grade 8 17% Proficient or Advanced
Grant Goals Research • Effect of professional development on • Teacher knowledge • Instructional practices • Student achievement
How will we achieve this work? Summer Institutes • 30 hours of mathematics content (2009 – 2011) • Focus – Curriculum, Instruction, Assessment • 40 hours of SB 472 (2009/2010) • 36 hours of follow up and research practicum • 30 hours culminating Research Institute (2011)
Academic Year • 24 hours of follow up • Analyzing student data, adjusting instruction, building on content knowledge • 12 hours of research practicum • Collaborate with university staff • Develop plan for action research
100 – 115 teachers, grades 5 – 8 (algebra) Johnny Rivera, Southeast Middle School
Teacher Commitment • TEACHER RESPONSIBILITIES • 3 year participation at the same grade level • Use instructional strategies specified at training • Share learning with PLC • Collaborate with administration on action research project • Work with director of the grant (observations, and coaching) Yesenia Medrano, Southeast Middle School
Summer Institutes • Dr. John Elwin • Dr. Rafaela Santa Cruz
Mini Lesson Student from Local District 6
MATHEMATICS INSTRUCTIONAL GUIDES (MIG) 6th Grade Unit 2, Concept 3 - Algebraic Thinking and Proportional Reasoning Standards: AF2.2 Demonstrate an understanding that rate is a measure of one quantity per unit value of another quantity. AF2.3 Solve problems involving rates, average speed, distance, and time. NS1.2 Interpret and use ratios in different contexts to show the relative sizes of two quantities, using appropriate notations. NS1.3 Use proportions to solve problems. Use cross-multiplication as a method for solving such problems, understanding it as the multiplication of both sides of an equation by a multiplicative inverse. NS1.4 Calculate given percentages of quantities and solve problems involving discounts at sales, interest earned, and tips.
MATHEMATICS INSTRUCTIONAL GUIDES (MIG) 6th Grade Unit 3, Concept 3 -Statistics, Data and Probability Standards: SDAP1.1 Compute the range, mean, median, and mode of data sets. SDAP1.3 Understand how the inclusion or exclusion of outliers affects measures of central tendency. SDAP1.4 Know why a specific measure of central tendency (mean, median, mode) provides the most useful information in a given context. SDAP2.3 Analyze data displays and explain why the way in which the question was asked might have influenced the results obtained and why the way in which the results were displayed might have influenced the conclusions reached. SDAP2.5 Identify claims based on statistical data and, in simple cases, evaluate the validity of the claims.
MATHEMATICS INSTRUCTIONAL GUIDES (MIG) Algebra Readiness Unit 2, Concept 1 -Decimals, Ratio and Proportions and Percents Standards: 7NS1.2 Add, subtract, multiply, and divide rational numbers (integers, fractions, and terminating decimals) and take positive rational numbers to whole-number powers. 7NS1.3 Convert fractions to decimals and percents and use these representations in estimations, computations, and applications.
Estimating the number of fish • Let L be the number of fish in the lake and assume we have tagged 50 fish. • Let b be the number of black beans and w the number of white beans in our sample. Then • is our proportion. Since we have computed b and w, we can calculate L.
Proportional Reasoning Estimating populations One method of estimating the number of fish in a lake is to catch and tag a collection of fish and then release them. At a later time we return and catch a sample of fish and determine the proportion of tagged fish.We can then use that proportion to estimate the total fish population in the lake. For example, suppose that we initially caught, tagged and released a total of 50 fish. If we return later and catch a total of 60 fish, 18 of which were tagged, we can then estimate of the number of fish in the lake? Let’s simulate this situation using a bag with an unknown number of white beans. For this exercise, please work in pairs at your table of 4. Remove 50 white beans and replace with 50 black beans (the tagged fish). Then using a scoop, have one partner remove a sample from the bag, count the respective numbers of black and white beans and return the sample to the bag. The other partner will then follow and do the same. Each person at the table should collect a sample, count the respectivenumbers and replace the sample. Let L denote the number of fish in the lake. Determine your estimate for L by setting up and solving a proportion. When you have calculated your estimate, please write your estimate on a dot and place the dot in the appropriate bin in the histogram of results we are constructing.
ACCESS STRATEGIES • Cooperative Learning Environment • Instructional Conversations • Academic Language Development (ALD) • Advanced Graphic Organizers
Workshop Guidelines • Work in small groups (usually 4) • Select rich problems with threads across grades guided by ‘big mathematical ideas’ and the MIG • Support and encourage participation in existing PLC groups • Foster a better understanding of issues faced by those teaching at other grade levels
Web Tool The CaMSP Web Tool will be available in June. It is an online community space for teachers to receive updates, review video examples, and share instructional strategies.
Video http://erickutner.com/staging/Tennis_v5.mov
The Research • Experimental Group/Control Group • Qualitative and Quantitative mixed methods design
Getting into the research • Pre and post test for teachers • Given each year to teacher participants • Classroom Observations • 2 trained research associates will observe teachers 3 times during the year with an observation instrument • Grant director will observe and coach teachers through the grant