Download
1 / 61
650 likes | 689 Views
Phosphorus and Phosphorus Management. Outline. Introduction P Sources P Transport Environmental Concerns P Management Summary. Introduction P-Crop Need P Forms P Cycle. Reactions in Soil (fate of P) P Buffer Capacity. Outline. P Sources P Transport

E N D
Outline • Introduction • P Sources • P Transport • Environmental Concerns • P Management • Summary
Introduction P-Crop Need P Forms P Cycle Reactions in Soil (fate of P) P Buffer Capacity Outline • P Sources • P Transport • Environmental Concerns • P Management • Summary
Plants need P for growth ATP DNA RNA P deficiency: stunted and spindly purplish foliage (older leaves) IntroductionP-Crop Need
IntroductionP-Crop Need Goal of soil testing = determine crop need - Examples of agronomic soil P tests: Bray P1, Mehlich III, Olsen
Inorganic P Fertilizers, soluble P PO43-, HPO42-, H2PO4- Immediately available Organic P Manure, plant/leaf residues Inositol phosphates, nucleic acids, phospholipids Slowly available (needs to be mineralized to inorganic form) IntroductionP Forms AS RELATED TO CROPS, SOILS, AND FERTILIZERS
Soil Test P estimates plant available P usually Bray P1 (in WI) expressed in ppm P (elemental P, not P2O5) Phosphate = P2O5 (oxide) fertilizer recommendations and product analysis given in oxide form conversion factors: 1 lb P = 2.29 lb P2O5 1 lb P2O5 = 0.44 lb P IntroductionP Forms AS RELATED TO CROPS, SOILS, AND FERTILIZERS
IntroductionP Forms AS RELATED TO WATER QUALITY • Particulate P (PP) • definition: P bound to eroded sediment or organic matter • also called sediment-P • Soluble P (SP) • definition: P dissolved in runoff (working definition: P that passes through a 0.45 micron filter) • also called dissolved P (DP), dissolved reactive P (DRP), and ortho-P • Total P (TP) • definition: total amount of P, both PP and SP, in soil or runoff
IntroductionP Forms AS RELATED TO WATER QUALITY • P Concentration • definition: amount of P per volume • expressed as: mg P/L or ppm • P Load • definition: total amount of P delivered • expressed as: mg P/ha (lb P/acre)
IntroductionP Reactions in Soil • Mineralization and Immobilization (organic P) Immobilization microbes Fe3+, Al3+, Ca2+ Organic P forms H2PO4- Fe, Al, Ca phosphates microbes insoluble fixed P soluble phosphate Mineralization
IntroductionP Reactions in Soil • Adsorption and Desorption • Clays, Fe and Al oxides, organic matter • Precipitation/Dissolution • Acid soils – Fe, Al, Mn compounds dominate • Alkaline soils – Ca compounds dominate What happens when fertilizer or manure P is added to soil? P is quickly and strongly bound to soil particles. (inorganic P)
IntroductionBuffer Capacity • P buffer capacity (indication of the rate of change of STP with additions or removals) Ave 18 lbs P2O5/acre to change STP by 1ppm (Leikam, 1992) • Time is needed to raise OR lower STP
Outline • Introduction • P Sources • Soil • Plants • Fertilizers • Manures • Livestock Feed • Municipal Waste • P Transport • Environmental Concerns • P Management • Summary
P SourcesSoil P occurs naturally in soil (but usually in very low concentrations)
P SourcesPlants • Vegetation can contribute P to runoff • plants release P when tissue is ruptured due to freezing, thawing, and drying
P SourcesFertilizers • Added to soil to increase fertility for crop production • Common examples: N-P2O4-K2O • Monoammonium phosphate: NH4H2PO4 11-48-0 • Diammonium phosphate: (NH4)2HPO4 18-46-0 • Triple superphosphate: Ca(H2PO4)2 0-46-0 • Easily soluble to runoff water (if rain comes shortly after application)
P SourcesManure • Manure contains nutrients for plant growth, including P • Manure applications improve physical properties of soil • Manure applications can lead to buildup of soil P
P SourcesManure Note: Manure supplies approximately equal amounts of N and P.
P SourcesLivestock Feed • Farm animals need adequate protein, energy, and nutrition • Dietary rations often contain excess nutrients, particularly P
P SourcesIndustrial and Municipal Waste • Water discharged from wastewater treatment facilities • Storm water runoff • Biosolids www.milorganite.com
Outline • Introduction • P Sources • P Transport • Runoff and Erosion • P Leaching • Environmental Concerns • P Management • Summary
Runoff =movement of water across the land’s surface Erosion =movement of soil particles by water P TransportRunoff and Erosion Runoff and erosion are SURFACE WATER quality problems.
P TransportLeaching • Leaching =infiltration of water through soil to groundwater (low on most Wisconsin soils) P leaching is a GROUNDWATER quality problem
P TransportLeaching Nutrient and Pest Management Program
Outline • Introduction • P Sources • P Transport • Environmental Concerns • Eutrophication • Soil Test P • Point/NonPoint Pollution • Urban/Agricultural • P Management • Summary
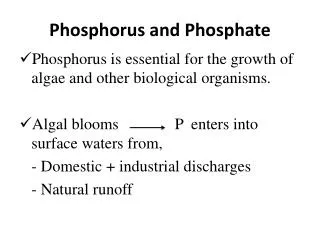
Environmental ConcernsEutrophication • Too little P = land degradation • Too much P = eutrophication What happens when a stream or lake receives more P than it is used to receiving?
Environmental ConcernsEutrophication P moves from soil to stream P stimulates algae growth Too much algae blocks sun, uses oxygen Fish can die, stream health declines = Odor, limits recreational uses, lowers drinking water quality
Environmental ConcernsSoil Test P Accumulation of P as a result of inputs exceeding removals
Environmental ConcernsSoil Test P As soil test P increases, the amount of P dissolved in runoff also increases. Natural runoff from April through July on corn plots at Arlington.
Environmental ConcernsSoil Test P N-based nutrient management strategy lbs/acre N needs met, but as a result, twice as much P as needed was applied. 160 320 120 60 45
Environmental ConcernsSoil Test P P-based nutrient management strategy lbs/acre P needs met, but will need supplemental N AND more acres to apply manure. 160 160 80 60 45
Environmental ConcernsPoint/Nonpoint Pollution • Point source pollution: Identifiable pollution discharge sources. • Nonpoint source pollution: Diffuse, hard-to-identify pollution sources transported by runoff and erosion from a widespread land area.
Environmental ConcernsUrban/Agricultural • Urban sources of P: • lawns: leaves, soil, fertilizer, animal droppings, plants • wastewater • biosolids • Agricultural sources of P: • manure • fertilizer • crop tissue • soil
Outline • Introduction • P Sources • P Transport • Environmental Concerns • P Management • Approaches to Improve P Balance • Management to Reduce P Losses • Summary
P Management - Improve P Balance NPM Program
P Management - Improve P Balance Follow Soil Test Recommendations • At optimum STP, recommended nutrients = anticipated crop removal • Soil test every 3-4 years
P Management - Improve P Balance Credit Nutrient Sources • Credit manure P BEFORE determining supplemental fertilizer application rates • Manure can supply crop nutrients as effectively as commercial fertilizers • Need nutrient content and application rate Lab analysis or book value Calibrate!
P Management - Improve P Balance Use Starter Judiciously • Recommendation: for corn band apply starter fertilizer if needed (10 lb N, 20 lb P2O5, 20 lb K2O) • On soils in the excessively high range for P, avoid starter applications in excess of 10-20-20
P Management - Improve P Balance Manage Dietary P Goal: avoid overfeeding P FOLLOW DIETARY P GUIDELINES • Dairy • know P content of dietary supplements • NRC recommends between 0.32 and 0.38%P, depending on milk production • Swine/Poultry • improve efficiency • consider feeding HAP corn • consider adding phytase enzyme to feed
P Management - Improve P Balance Manage Dietary P Phosphorus level in the manure is directly related to the level of P intake. % P in diet Source: Powell et al, 2001
P Management - Improve P Balance Manage Dietary P Dairy manure applied at 25 ton/a Source: Ebeling et al, 2002
P Management - Improve P Balance Manage Dietary P One year after manure application, the cumulative runoff dissolved P losses were significantly higher from the plots with high P diet manure compared to the low P diet manure and control. Source: Ebeling et al, 2002
P Management - Improve P Balance Increase land base • Ensure all cropland receives manure sometime during the rotation • Apply manure to rented land • Obtain manure application rights from neighboring grain farmers
Source Transport P LOSS P Management - Reduce P Loss In order for P to reach surface water: need both a SOURCE of P and MOVEMENT of P
P Management - Reduce P Loss Identify low risk sites • Source and transport – site specific: • P Index: http://wpindex.soils.wisc.edu • SNAP-Plus: www.snapplus.net
P Management - Reduce P Loss Identify low risk sites Total Risk Index (PI) = [Soluble P + Particulate P + Acute P] * total P delivery ratio Needed for PI calculations: -management, cropping rotations, tillage, fertilizer and manure applications, soil test P, slope, distance to surface water, etc.