Download
1 / 2
20 likes | 149 Views
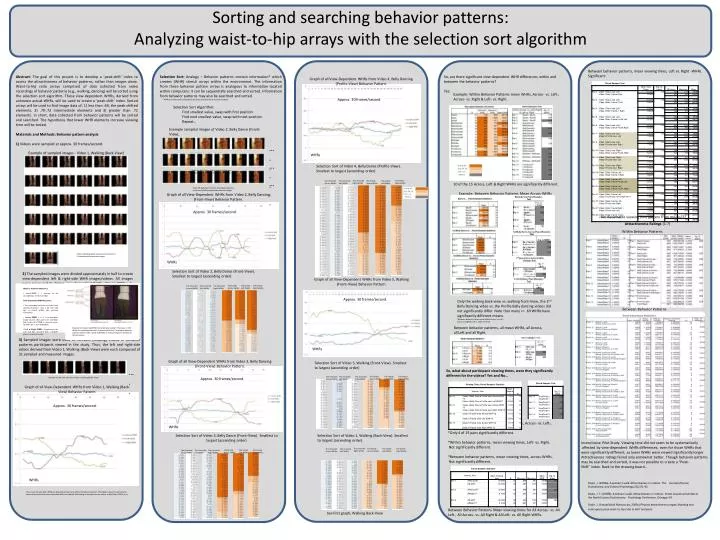
Sorting and searching behavior patterns: Analyzing waist-to-hip arrays with the selection sort algorithm. Between behavior patterns, mean viewing times, Left vs. Right -WHRs. Significant:.

E N D
Sorting and searching behavior patterns: Analyzing waist-to-hip arrays with the selection sort algorithm Between behavior patterns, mean viewing times, Left vs. Right -WHRs. Significant: Abstract: The goal of this project is to develop a ‘peak-shift’ index to assess the attractiveness of behavior patterns, rather than images alone. Waist-to-hip ratio arrays comprised of data collected from video recordings of behavior patterns (e.g., walking, dancing) will be sorted using the selection sort algorithm. These view-dependent WHRs, derived from unknown actual-WHRs, will be used to create a ‘peak-shift’ index. Sorted arrays will be used to find image data of: 1) less than .69, the peak-shifted elements, 2) .70-.72 intermediate elements and 3) greater than .72 elements. In short, data collected from behavior patterns will be sorted and searched. The hypothesis that lower WHR elements increase viewing time will be tested. Materials and Methods: Behavior pattern analysis 1) Videos were sampled at approx. 30 frames/second. Selection Sort: Analogy – Behavior patterns contain information* which creates (WHR) stimuli arrays within the environment. The information from these behavior pattern arrays is analogous to information located within computers: it can be sequentially searched and sorted. Information from behavior patterns may also be searched and sorted. * WHRs are information, distance across waist and distance across hips are data. So, are there significant view-dependent WHR differences within and between the behavior patterns? Yes: Example: Within Behavior Patterns mean WHRs, Across- vs. Left-, Across- vs. Right & Left- vs. Right Approx. 30 frames/second. Selection Sort Algorithm: Find smallest value, swap with first position Find next smallest value, swap with next position Repeat… Example sampled images of Video 2, Belly Dance (Front-View). Example of sampled images - Video 1, Walking (Back-View) WHRs Selection Sort of Video 4, Belly Dance (Profile-View). Smallest to largest (ascending order) 10 of the 15 Across, Left & Right WHRs are significantly different. Approx. 30 frames/second. No discernable viewing time pattern from means??? Attractiveness Ratings (1-7) Within Behavior Patterns Video 1, Walking (Back-View) was composed of 31 sampled and measured images. WHRs Selection Sort of Video 2, Belly Dance (Front-View). Smallest to largest (ascending order) Graph of all View-Dependent WHRs from Video 5, Walking (Front-View) Behavior Pattern. Approx. 30 frames/second. Between Behavior Patterns Between behavior patterns, all mean WHRs, all Across, all Left and all Right. 3) Sampled images were used to recreate (looping) videos of behavior patterns participants viewed in the study. Thus, the left and right-side videos derived from Video 1, Walking (Back-View) were each composed of 31 sampled and measured images. WHRs Selection Sort of Video 5, Walking (Front-View). Smallest to largest (ascending order) So, what about participant viewing times, were they significantly different for the videos? Yes and No… Example of Left-Side view from Video 1, Walking (Back-View) Approx. 30 frames/second. Approx. 30 frames/second. Within behavior patterns, mean viewing times, Across- vs. Left-, Across- vs. Right. *Only 4 of 15 pairs significantly different. *Within behavior patterns, mean viewing times, Left- vs. Right. Not significantly different. *Between behavior patterns, mean viewing times, across-WHRs. Not significantly different. WHRs Selection Sort of Video 3, Belly Dance (Front-View). Smallest to largest (ascending order) Selection Sort of Video 1, Walking (Back-View). Smallest to largest (ascending order). Inconclusive Pilot Study. Viewing time did not seem to be systematically affected by view-dependent WHRs differences, even for those WHRs that were significantly different, as lower WHRs were viewed significantly longer. Attractiveness ratings faired only somewhat better. Though behavior patterns may be searched and sorted, it was not possible to create a “Peak- Shift” index. Back to the drawing board… WHRs • Doyle, J. (2009a). A woman’s walk: Attractiveness in motion. The Journal of Social, Evolutionary, and Cultural Psychology,3(2), 81-92. • Doyle, J. F. (2009b). A woman’s walk: Attractiveness in motion. Poster session presented at the North Eastern Evolutionary Psychology Conference, Oswego, NY. • Doyle, J. (Unpublished Manuscript, 2009c) Physical attractiveness ranges: Standing and contraposto pose waist-to-hip ratio in 360° and pairs. Between Behavior Patterns Mean viewing times for All Across- vs. All Left-, All Across- vs. All Right & All Left- vs. All Right WHRs. See first graph, Walking Back-View • ….. Video 2A, Belly Dance (Front-View) Across was composed of 53 sampled and measured images. • ….. Video 2L, Belly Dance (Front-View) Left Side was composed of 53 sampled and measured images. • ….. Video 2R, Belly Dance (Front-View) Right Side was composed of 53 sampled and measured images. Example: Between Behavior Patterns Mean Across-WHRs Graph of all View-Dependent WHRs from Video 2, Belly Dancing (Front-View) Behavior Pattern. The Unsorted Right-WHRs: The Unsorted Right-WHRs: The Sorted Right-WHRs: The Sorted Right-WHRs: The Sorted Right-WHRs: The Sorted Right-WHRs: The Sorted Right-WHRs: The Sorted Across-WHRs: The sorted Left-WHRs: The Sorted Across-WHRs: The Sorted Across-WHRs: The sorted Left-WHRs: The sorted Left-WHRs: The Sorted Across-WHRs: The Sorted Across-WHRs: The sorted Left-WHRs: The sorted Left-WHRs: The Unsorted Left-WHRs: The Unsorted Right-WHRs: The Unsorted Left-WHRs: The Unsorted Right-WHRs: The Unsorted Right-WHRs: The Unsorted Across-WHRs: The Unsorted Across-WHRs: The Unsorted Left-WHRs: The Unsorted Left-WHRs: The Unsorted Across-WHRs: The Unsorted Across-WHRs: The Unsorted Across-WHRs: The Unsorted Left-WHRs: Graph of all View-Dependent WHRs from Video 4, Belly Dancing (Profile-View) Behavior Pattern. Graph of all View-Dependent WHRs from Video 3, Belly Dancing (Front-View) Behavior Pattern. 2) The sampled images were divided approximately in half to create view-dependent left & right-side WHR images/videos. All images were measured to derive view-dependent WHRs. (Doyle 2009 a, b, c). Only the walking back-view vs. walking front-View, the 2nd Belly Dancing video vs. the Profile Belly dancing videos did not significantly differ. Note that many >= .69 WHRs have significantly different means. *Between Behavior Pattern mean WHRs Across- vs. Left-, Across vs. Right & Left vs. Right omitted. Waist to Hip Ratio Measures: • Actual-WHR = a measure of the circumference of the waist/hips. View-Dependent WHR Measures: • View-dependent measures are taken from anatomical markers, such as the waist and hips, in frontal, profile, side, posterior orientations. • Across-WHR = is a view-dependent length measure taken across the waist/hips. Exp: frontal-view WHR is a measure across the body and is view-dependent. • Left & Right-WHR = length across the waist and hips measured from a medially placed, vertical centerline. Example of measuring WHRs from a behavior pattern. The lower (< .69) WHRs are hypothesized to be “Supernormal Stimuli” created by behavior patterns which create a peak shift effect in male perceptions of physical attractiveness. • ….. Graph of all View-Dependent WHRs from Video 1, Walking (Back-View) Behavior Pattern. The across, left and right- WHRs are depicted as they occur within the behavior pattern. The highest , (least attractive), and lowest (most attractive) view-dependent WHRs are labeled. Alternating sinusoidal sides are clearly visible (Doyle 2009a, b, c).
A Woman’s Walk: Attractiveness in Motion Poster presentation by James Doyle JSEC Article available @ www.jsecjournal.com Abstract: Men are attracted to the movements of women’s bodies. The aim of this paper is to answer the question: what is the mechanism? The role of the peak shift effect in perceptions of physical attractiveness involving women’s waist-to-hip ratios (WHRs) in biological motion is presented. Photographs of a coordinated motor pattern, walking, are investigated with a novel measurement method. Evidence is presented that the behavior pattern contains alternating left and right side, attractive (S+) and unattractive (S-), WHR stimuli. The presence of a WHR stimulus range that is sufficient to generate a peak shift effect in perceptions of physical attractiveness is established. It is predicted that WHRs in attractive behavior patterns will be significantly lower than those previously found to be preferred using 0.70 WHR still images. Therefore WHRs in motion represent S++, or “supernormal stimuli”, in behavior. Observing Behavior Patterns: Walking Note the view-dependant WHR-across the .70 actual-WHR figure is substantially less than .70. Higher actual-WHRs in motion may create supernormal stimuli in behavior that effectively peak shifts perceptions of physical attractiveness. Ontogenetic Attunement & Phylogenetic Adaptation: rationale for the attractiveness of S + and S++ sexually selected traits from signal detection theory WHR .69 across. L-R WHR(.52|1.0) WHR .66 across. L-R WHR(.62|.68) WHR .70 across. L-R WHR(.45|1.14) WHR .82 across. L-R WHR(.43|1.90) Supernormal Stimuli Peak Shift Perceptions of Physical Attractiveness By adding a vertically placed centerline and calculating separate WHRs from it for both the right and left side sinusoidal curves, it can be seen that frontal-view WHRs of substantially less than 0.70 and nearing 1.0 continuously alternate while walking. Hence, behavior patterns contain supernormal stimuli which may peak shift perceptions of physical attractiveness. View-Dependant Supernormal WHRs in a Dance-Like Proceptive Behavior Sequence? Alternating sinusoidal curves while walking. As the leading leg moves forward while walking, the lower body and torso align vertically causing the curve between the waist and hip to straighten increasing the WHR from an observer’s perspective. Simultaneously, on the opposite or trailing side of the body, the hip can be seen to jut outward accentuating the actual 0.70 WHR curve between the waist and hip. Peak shiftoccurs in generalization tests following intradimensional discrimination training as a displacement of peak responding away from the S+ (a stimulus signaling availability of reinforcement) in a direction opposite the S– (a stimulus signaling lack of reinforcement) (Keith, 2002). Measuring Supernormal Stimuli in Behavior • While walking, the waist and hip on opposing sides of the body may both be conceptualized to be oscillatory sinusoidal curves alternately acting as S+ (preferred) and S- (non-reinforcing) stimuli. Actual .70 WHR images: ~ Perceived Attractiveness S – S+ S++ WHRs WHRs differentiate boys, girls and men as NOISE from reproductive age women’s WHR SIGNALS in ontogeny. If in phylogeny then, a signal detection system for WHR signals that detects as a perception of physical attractiveness < ≈ .75 WHRs, fitness would accrue to the bearers of the adaptation. Physical attraction to reproductive age women’s WHR stimulus ranges (in motion) would produce evolutionarily relevant “HITs”, opposed to correct rejections and misses. Hits in “YES” range explain the attractiveness of WHR d’ range from moving stimuli. Sexual selection may have adapted the d’ range for the attractiveness of WHR stimuli from ancestral population means, while behavior patterns create supernormal stimuli that peak shift perceptions of physical attractiveness. *Follow-up paper submitted to JSEC 8/15/09 Waist to Hip Ratio Measures • Photograph of an adult female model with an actual* and frontal view-dependant 0.70 WHR-across** *Actual-WHR = circumference of the waist/hips **Across-WHR (e.g., frontal, profile, side & posterior) = length across the waist/hips. WHR-across the figure is, “view-dependant”. (exp: 44/ 63 pixels = .698 across-WHR) Peak Shift Noise Signal + Noise .74 WHR-across WHR Criteria WHR >.8 (≈.80-1.0?) stimuli ranges WHR <.8 (≈.75-.40?) .55 Left-side WHR 43 Left-side WHR .81 .94 Right-side WHR 53 79 WHR-across .72 109 d’ Correct Rejection 36 Hit Right-side WHR .64 56 False Alarm Miss Alternating Left & Right WHRs: (.81|.64) Alternating Left & Right WHRs: (.55|.94) No range Yes Range