Download
1 / 27
270 likes | 407 Views
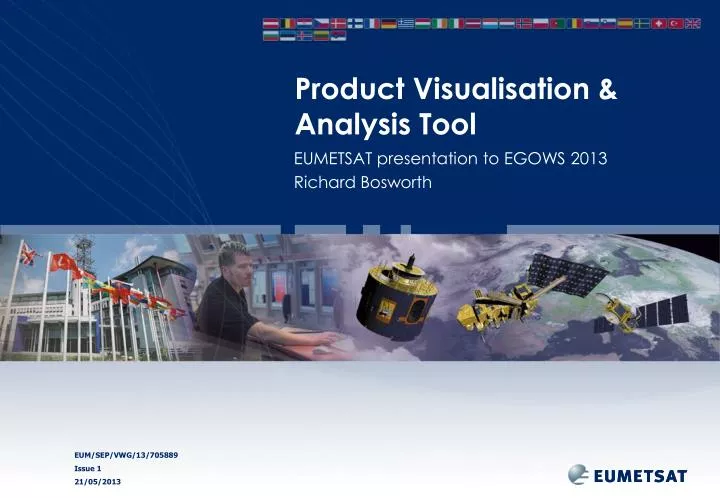
Product Visualisation & Analysis Tool. EUMETSAT presentation to EGOWS 2013 Richard Bosworth. EUMETSAT. EUMETSAT was formed in 1986 with the objective to provide, from space, information that can be used in weather forecasting and climate applications.

E N D
Product Visualisation & Analysis Tool EUMETSAT presentation to EGOWS 2013 Richard Bosworth
EUMETSAT • EUMETSAT was formed in 1986 with the objective to provide, from space, information that can be used in weather forecasting and climate applications. • EUMETSAT is an intergovernmental organisation, formed to service the Member and Cooperating States which fund our activities. • Much more at http://www.eumetsat.int • Much, much more at http://en.wikipedia.org/wiki/EUMETSAT
EUMETSAT spacecraft • Geostationary: METEOSAT (7, 8, 9 & 10) • Low Earth Orbit: METOP (A & B)
Previously, from EGOWS 2003 • EUMETSAT operates meteorological satellites for its member states • In addition to image data, level 2 geophysical products are produced • Products are derived from image data and forecast data • Products are validated by comparison with observations from balloons, ships, aircraft • Graphics workstation is used to display all these data, allowing the analysis of the images and products by meteorologists • MWS - Original system in MTP ground segment, fixed set of products, fixed layout for each product • PQM - Part of MSG ground segment, uses a data dictionary, and visualization templates to enable analysis of many products in different ways, without software changes • PQM can handle data in internal formats and in BUFR
Problems with legacy visualisation tools • COTS or hardware specific implementations • Not easy to implement new features or products • Not able to handle newer formats (GRIB2, netCDF, HDF, etc) • Flexibility implemented only for certain modes of usability • Result: • Tools that cannot be easily enhanced • Users creating their own visualisation tools • Therefore, a need to find a replacement
The hunt for a replacement • Visited EGOWS in 2003, 2004, 2007, 2009 & 2013 • EGOWS provides a unique opportunity to see what is available • But, EUMETSAT have a unique set of requirements: • Internal formats unknown to third parties • Encoded formats specific to a small community • Specific display operations required by EUMETSAT users • A focus on product content display • Specific processes for EUMETSAT to procure goods
Decision to procure a new tool • Be based on a commodity Intel/Linux platform • Be based (as much as possible) on existing tools & COTS • Use no hardware acceleration features • Be as flexible as possible in design, implementation & usability • Be a platform that can be easily enhanced for: • new products, new encoding formats, new visualisation types, new projections • Result: Product Visualisation & Analysis Tool (PVA) • Developed for EUMETSAT by • ask - Innovative Visualisierungslösungen GmbH
PVA lattice concept Node Route
PVA template • Lattice structure • Node instances • All node property settings, defining amongst others: • base product, anchor time, explicit/implicit frame sequence (time slots) • Routing information • MMI settings • Panels • All panel property settings, defining amongst others: • Visibility, position, size, state (legend, minimised, maximised, ...), docking
PVA hardware • Dell T1600 / T1650 PC workstations • 3.2GHz Xeon, 16GB RAM, NVidia 1GB graphics, 1TB disk • Dell 24-inch U2410 LED monitor (1920 x 1200) • openSuSE 12.2