Download
1 / 27
280 likes | 699 Views
Scales and Indices. While trying to capture the complexity of a phenomenon. We try to seek multiple indicators, regardless of the methodology we use: Qualitative : we prepare a sequence of questions and then ask more questions that help us clarify the issue of investigation

E N D
While trying to capture the complexity of a phenomenon • We try to seek multiple indicators, regardless of the methodology we use: • Qualitative: we prepare a sequence of questions and then ask more questions that help us clarify the issue of investigation • Quantitative: we construct several questionnaire items that help identify the concept
Composite Measures In quantitative research are the • Sequence of items that • Target the same issue • Within the same questionnaire • To achieve a fuller representation of the concept under investigation
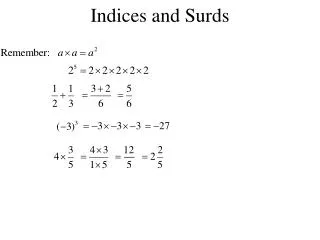
Index • Babbie (2004, p. 152): A type of composite measure that summarizes and rank-orders several specific observations and represents some more general dimensions * In other words:it combines several distinct indicators of a construct into a single score generally is a sum of scores of such indicators
Index Example:a) your first exam contained 67 objective multiple-choice questions. The number of correct answers you received is the index of your understanding of the subject. b) your first project in this class has a checklist of issues to be addressed while you are working on it. The number of checkmarks you make on it once completing the project is your index of how ready it is for submission.
Index • Neuman (2000, p. 177): “Base your answers on your thoughts regarding the following four occupations: long-distance truck driver, medical doctor, accountant, telephone operator. Score each answer 1 for yes and 0 for no: 1. Does it pay a good salary? 2. Is the job secure from lay-offs 3. Is the work interesting and challenging? 4. Are its working conditions good? 5. Are there opportunities for career advancement? 6. Is it prestigious or looked up to by others? 7. Does it permit freedom in decision-making?”
Index Construction • Establish the face validity : - Do your items pertain to the population? - Are your items general or specific? - Do the items provide enough variance? • Examine bivariate relationships (logical consistency between all items) • Examine multivariate relationships (correspondence between one group of items measuring the same thing and another group of items measuring the same thing)
Index Scoring • What is your measurement range? • Is there an adequate number of cases for each index point? • Is there a need to assign weights to items? *If unweighted, each of your items has the same value for the concept, so sum up * Weighting changes the theoretical definition of the construct, as some items matter more than others
Scale • Babbie (2004, p. 152): A type of composite measure composed of several items that have a logical or empirical structure among them * In other words: allows to measure the intensity or direction of a construct by aligning the responses on a continuum
Scale • Exist in a variety of types • Five most widely known are: - Likert scale - Bogardus Social Distance scale - Thurstone scale - Guttman scale - Semantic Differential scale
Likert Scale Neuman (2000, p. 183) Neuman (2000, p. 183)
Semantic Differential Scale Babbie (2004, p. 171)
Bogardus Social Distance Scale This social distance scale was taken from http://garnet.acns.fsu.edu/~jreynold/bogardus.pdf
Guttman Scale Neuman (2002, p. 191)
Thurstone Scale Neuman (2000, p. 187)
Scale Scoring • Response frequencies could be used to identify the intensity (direction, potency, etc.) of a construct • Often, if several scales are used to identify a construct, the responses are summed and averaged in order to receive an index.
Validation • Internal validation: *Item analysis:An assessment of whether each of the items included in a composite measure makes an independent contribution or merely duplicates the contribution of other items in the measure (Babbie, 2004, p. 164) Is conducted through a variety of statistical techniques: - Regression - Factor Analysis
Validation • External validation: *The process of testing the validity of a measure by examining its relationship to other presumed indicators of the same variables (Babbie, 2004, p. 165) Is conducted by - trying it on a population with apparent traits - statistical procedures of establishing concurrent and predictive validity (often simple correlations)
Bad Index vs. Bad Validators Fails the Internal Validation: • Item analysis can show presence of inconsistent relationships between the items • Item analysis can show that the contribution of an item is insufficient • The overall model is not supported by the data you collected *Generally means that you need to either go back and re-think your theory orlook for more relationships between the items in your model
Bad Index vs. Bad Validators Fails the External Validation: • The index does not adequately measure the variable in question • The validation items do not adequately measure the variable thus, do not provide a sufficient testing power *Generally means that you need to go back and re-examine you measure before blaming it on the validators
Missing Data • Try to guess from previous responses what value to insert (not a good idea) • Substitute the average score for cases where data are present (creates threats to validity) • Eliminate all cases for which any information is missing (reduces the size of the usable data)
Non Probability • Do not know the size of the population from which the sample was drawn. • Therefore, do not know how representative are their responses, controlling for their social-demographic characteristics.
Non Probability • Purposive • Snowball • Quota • Selected Informants
Probability • Do know the size of the population from which the sample was drawn. • Do know how representative are their responses, controlling for their social-demographic characteristics.
Probability • Simple Random • Systematic • Stratified • Multistage • Probability Proportionate to Size • Disproportionate with Weighting
Probability • Bias: Effect of theoretically relevant characteristics on responses. • Population, Study Population, Sampling Frame, Sampling Unit • Sampling Error