Download
1 / 30
300 likes | 379 Views
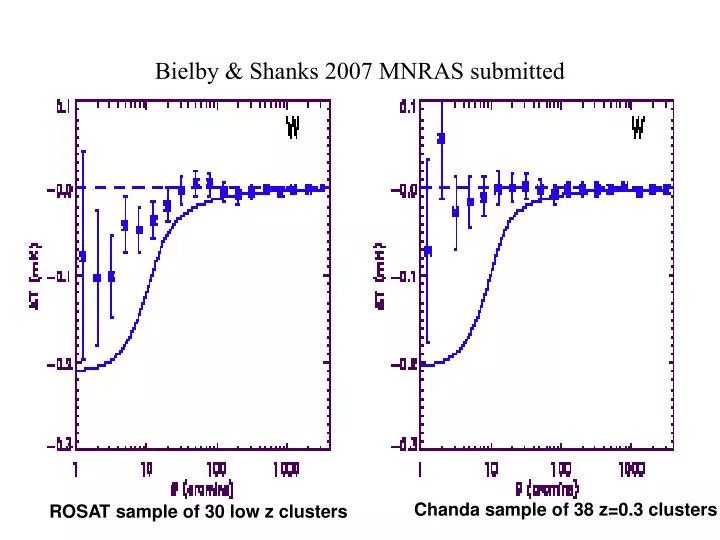
Bielby & Shanks 2007 MNRAS submitted. Chanda sample of 38 z=0.3 clusters. ROSAT sample of 30 low z clusters. Interstellar Neutral Hydrogen Emission Structure and Radio Frequency Continuum Radiation (WMAP) Signals. Gerrit L. Verschuur Physics Department University of Memphis.

E N D
Bielby & Shanks 2007 MNRAS submitted Chanda sample of 38 z=0.3 clusters ROSAT sample of 30 low z clusters
Interstellar Neutral Hydrogen Emission Structure and Radio Frequency Continuum Radiation (WMAP) Signals • Gerrit L. VerschuurPhysics DepartmentUniversity of Memphis
Hydrogen line (HI) data side-lobe corrected • H-line is a spectral signature at 1,420 MHz or 21-cm wavelength of hydrogen gas between the stars • Used the Leiden-Dwingeloo All Sky Survey • Hartmann & Burton (1997) • Sidelobe corrected • Plus some from LAB Survey - Kalberla et al. (2005) • All data will be displayed in galactic coordinates - longitude (l) & latitude (b)
Low velocity I used 25 HI maps like this to explore the relationship between HI and WMAP structure in this area of sky
Overlay WMAP +ve contours on HI inverted gray-scale map HI -130 to -120 km/s In general, anomalous vel. HI are in the proximity of WMAP peaks.
Peak at -126 km/s Peak at -116 km/s Inverted grayscale - HI Contours WMAP peaks
A possible model -1 Intercloud plasma Depending on how the line-of-sight intersects the colliding HI features, we may expect to observe alignment of WMAP peaks and HI peaks, or offset peaks
V= - 118 km/s v= - 87 km/s
Calculate expected number of associations • Probability that a given WMAP peak will lie within a distance r of an HI peak located in an area A is: • r2 A-1 • But we have many WMAP peaks and very many HI peaks at different velocities
Calculate expected number of associations • Nwpeaks = 33 consider the 33 brightest • Nhpeaks ~ 550/3 ~ 183 visible over 3 maps on average • N= number of cases where direct association is expected in this area, A (=4,800 square degrees) • N = r2 A-1 NWpeaks NHpeaks.
What did this show? • For the 1st time, high velocity and intermediate velocity HI structures have been found to be directly associated • They both appear to be associated with a lack of low-velocity HI • All three are associated with enhanced continuum emission
WMAP +ve contours HI - inverted gray-scale Ha
A possible model -1 Intercloud plasma Depending on how the line-of-sight intersects the colliding HI features, we may expect to observe alignment of WMAP peaks and HI peaks, or offset peaks
HVC MI HI contours Excess soft X-ray emission Herbstmeier et al. This lead to a prediction in November, 2006 HVC MII will be associated with continuum emission
Testing a prediction HVC MII would show something similar to HVC MI
Ha excess Soft X-ray excesses At the location of the WMAP peaks, the HI profiles are double peaked
Overlay WMAP +ve contours on HI inverted gray-scale map HI -130 to -120 km/s In general, anomalous vel. HI are in the proximity of WMAP peaks.
Overview • Since December I have used WMAP data kindly provided by Gary Hinshaw and Wayne Landsman and compared those data with over 500 HI maps at 2 km/s intervals for small regions of sky. • The pattern that has emerged is that when the WMAP peak is clearly associated with HI more than one HI feature is involved • Collisions?
Conclusions: general • Welcome Back to the Galaxy! • WMAP small-scale structure may have a significant contribution from foreground features associated with HI structure • It is possible that all the small-scale WMAP continuum emission structure has a Galactic origin • By examining HI structure in the direction of WMAP continuum emission peaks at intermediate and high galactic latitudes the study of galactic HI is suddenly made very interesting
Suggestions for the future • Convert young cosmologists to the study of interstellar structure • . . . . before they get lost in the cosmos • Extend study to other areas of the sky - a vast opportunity for new discovery • It is likely that plasma phenomena are key to understanding interstellar structure • Invite plasma physicists to meet with astrophysicists studying interstellar structure to create common ground
Reports • Further Evidence for the Critical Ionization Velocity Signature in Interstellar Neutral Hydrogen Emission Profiles • IEEE Transaction on Plasma Science - August 2007 • This paper offers an explanation for the mechanism for producing weak continuum emission at the interface between colliding HI features • High Galactic Latitude Interstellar Neutral Hydrogen Structure and Associated High Frequency Continuum Emission • Being reviewed for Astrophysical Journal
Acknowledgments • Dap Hartmann & Butler Burton for providing the LDS All-Sky Survey data last century • Wayne Landsman of the WMAP group for providing WMAP ILC data for the Target Area in a form I could use (uniform l-b grid) • Butler Burton for his encouragement and valuable discussions • Joan Schmelz for her encouragement, valuable discussions, critical readings of my MSs, comments on PPTs, and understanding of the key issues • Tom Dame for his “holy grail” program using a data cube that allowed me to make HI maps with ease • Richard Lieu and Jonathan Mittaz for helpful discussions
v- -8 to +2 km/s Hole in local HI at the location of the HI peaks at high and intermediate velocities This has never before been observed All are associated with the WMAP peak