Download
1 / 9
100 likes | 433 Views
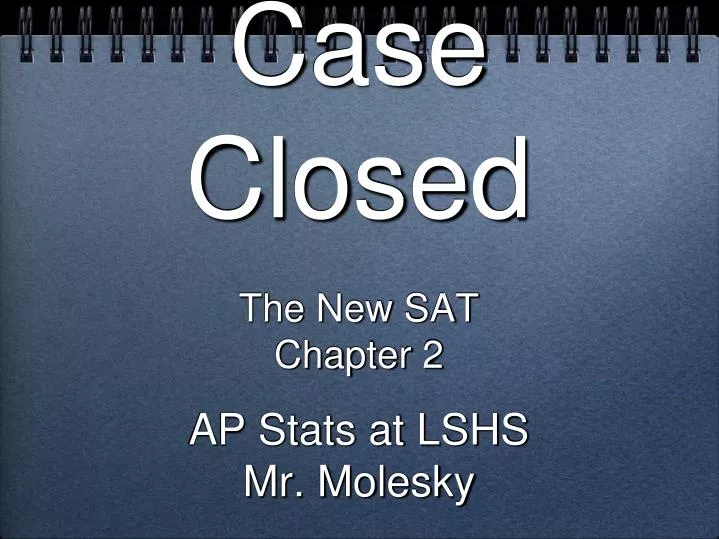
Case Closed. The New SAT Chapter 2 AP Stats at LSHS Mr. Molesky. ≈N(516, 115). 700. %Below 700≈.9452. %Below 600≈.7673. 600. 516. SAT Writing Scores. %Between 600 and 700≈.9452-.7673≈.1779. I: Normal Distributions. 1. SAT Writing Scores are N(516, 115)

E N D
Case Closed • The New SAT • Chapter 2 • AP Stats at LSHS • Mr. Molesky
≈N(516, 115) 700 %Below 700≈.9452 %Below 600≈.7673 600 516 SAT Writing Scores %Between 600 and 700≈.9452-.7673≈.1779 I: Normal Distributions • 1. SAT Writing Scores are N(516, 115) • What percent are between 600 and 700?
0.65 ≈N(516, 115) ? 516 SAT Writing Scores I: Normal Distributions • 1. SAT Writing Scores are N(516, 115) • What score would place a student in the 65th Percentile?
≈N(491,110) 502 491 Male Writing Scores II: Comparing Observations • 2. Male scores are N(491,110) • Female scores are N(502,108) • a) What % of males earned scores below 502?
≈N(502,108) 491 502 Female Writing Scores II: Comparing Observations • 2. Male scores are N(491,110) • Female scores are N(502,108) • b) What % of females earned scores above 491?
85th %-ile for Females ≈N(491,110) 491 614.32 Male Writing Scores II: Comparing Observations • 2. Male scores are N(491,110) • Female scores are N(502,108) • c) What % of males earned scores above the 85th %-ile of female scores?
III:Determining Normality • 3a. Did males or females perform better? The male and female scores are very similar. Both have roughly symmetric distributions with no outliers. The median for females is slightly higher (580 vs 570), but the male average is slightly higher (584.6 vs 580). Both have similar ranges, but the males had slightly more variability in the middle 50%.
III:Determining Normality • 3b. How do the male scores compare with National results? The males at this school did much better than the overall national mean (584.6 vs. 516). Their scores were also more consistent as evidenced by a lower standard deviation (80.08 vs 115).
III:Determining Normality • 3c. Are the male and female scores approximately Normal? The Normal Quantile Plots for both the male and female scores are approximately linear. Therefore, there is evidence that their scores are approximately Normal.