Download
1 / 45
450 likes | 545 Views
Climate Change Policy – A UK perspective. Jill Duggan Head of International Emissions Trading Climate and Energy – Business and Transport UK Department for Environment, Food and Rural Affairs Jill.duggan @defra.gsi.gov.uk http://www.defra.gov.uk/. The problem and the case for action.

E N D
Climate Change Policy – A UK perspective Jill Duggan Head of International Emissions Trading Climate and Energy – Business and Transport UK Department for Environment, Food and Rural Affairs Jill.duggan@defra.gsi.gov.uk http://www.defra.gov.uk/
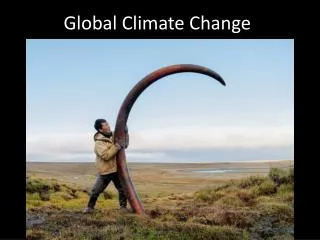
There is consensus in the UK on the central scientific findings of global warming – a problem that requires urgent action • Global warming is real: average surface temperature has increased by 0.74C over • the last hundred years, a rate and scale likely to have been greater than at any time in • at least the past 1000 years. • Global warming is man-made: most of the warming over the last 50 years is • attributable to greenhouse gases from human activities. The risk of serious human impacts increases strongly without mitigation There will be an increasing severity in the number of people dying from hunger, water shortages, heat-related stress and malaria 2oC Even if mitigation was sufficient to contain annual emissions at today’s level, the world is likely to experience a 2oC warming above pre-industrial levels by 2050 5oC Without significant mitigation, on business as usual trends, there will be a 50:50 chance of exceeding a 5oC temperature increase by the end of the 21st Century 5oC is the difference between temperatures now and the last ice age IPCC Fourth Assessment Report (2007). Stern Review (2006).
The challenge is to stabilise global greenhouse gas concentrations to avoid the worst of these climate change risks Global emissions (GtCO2e) • The Stern Review recommends a stabilisation goal of no more than 550ppm CO2e • To achieve this would require that global emissions peak in the next 10-20 years • Delaying the peak in emissions by 10 years would double the rate of reduction required • The UK target of a 60% CO2 reduction by 2050 is consistent with the Stern goal Stern Review (2006); ‘ppm’ = parts per million concentrations in the atmosphere.
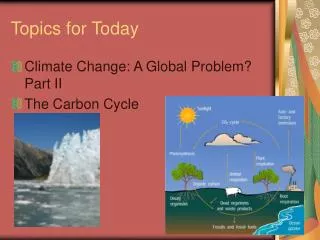
The poorest countries and people will suffer the most Change in cereal production in developed and developing countries for 3C warming • Many developing countries are likely to be particularly vulnerable to the impacts of climate change, due to their geography, their dependence on agriculture, and/or their lower incomes and access to resources. • Poorest people in richer countries are vulnerable as they are most likely to live in marginal lands, have fewer financial resources to adapt to climate change (e.g. insurance), and are least likely to be aware of the risk of a severe weather event. Agriculture in higher-latitude developed countries is likely to benefit from moderate warming (2-3 C), but even small amounts of climate change in tropical regions will lead to declines in yield. Changes in cereal production for a doubling of carbon dioxide levels (roughly equivalent to 3C in the models used) The key relates to the three simulation models used Source: Stern Review Stern Review (2006)
The costs of stabilising the climate are manageable – delay would be dangerous and much more costly • Delay is a dangerous option because damages from climate change rise disproportionately with temperature. • For example, a 25% increase in storm wind speeds is associated with an almost 7-fold increase in damages to buildings. • Adaptation is crucial for responding to unavoidable climate change but there are limits to how much it is possible to adapt to the worst effects. • For example, climate change could lead to floods, massive population shifts, and wars over natural resources; it would be very difficult to adapt to these changes. Also, ecosystems are unlikely to be able to adapt at the rapid rates of change expected. 1% GDP Costs of mitigation to stabilise emissions at 550ppm by 2050 vs 5% GDP Income lossesif we do nothing: market impacts only 20% GDP Income loss including non-market impacts, risk and equity Stern Review (2006)
Progress in tackling greenhouse gas emissions in the UK 15.3% reduction Other (F-gases) Nitrous oxide Methane Carbon dioxide MtCO2e Defra Statistical Press Release (31 January 2007), 2005 UK climate change sustainable development indicator and greenhouse gas emissions final figures
Decarbonising our largest sources of emissions requires significant further effort Greenhouse gas emissions by source (shares of total CO2e) In the UK Emissions from electricity generation, buildings (heating) and transport account for around 70% of all greenhouse gas emissions (largely CO2) Global: Stern Review (2006). UK: Fourth National Communication (2006). Different compilation methodologies mean that the global/UK sector comparisons are illustrative but not exact. UK land use has negative emissions.
2000 Climate Change Programme and early action on climate change • UK Voluntary Emissions Trading Programme • Climate Change Levy • Climate Change Agreements • EU Emissions Trading Phase I
UK Voluntary Emissions Trading Program 2002 – 2006 • 6 greenhouse gases • Purpose – learning by doing • Emissions reductions • Help City of London to become a centre for Carbon Trading • Descending Clock Auction • Met 5 year target in 1st year • Toughened targets
UK Emissions Trading Scheme • 33 participants committed to reduce emissions by 3.96 mtCO2e by the end of the scheme, • received Government incentive money for meeting their annual targets • So far UK ETS has delivered emissions reductions of over 15.9 mtCO2e. This includes an extra 8.9mtCO2e, pledged by 6 leading particpants in 2004, through tighter targets. • 2006 figures not yet finalised. • Enabled “learning by doing” for both participants and Government ahead of international emissions trading
Climate Change Levy • Introduced in 2001 • Energy tax applied to industry, commerce, agriculture, and the public sector • Adds about 10-15% to fuel bills • Exemptions for renewable sources and CHP • Most companies could save the cost of the Levy by simple better management, without investment in energy saving technology
Climate Change Levy – “Revenue Neutral” Revenues from the Levy are returned to industry through • a 0.3% reduction in the rate of employer’s National Insurance Contributions • funding of the Carbon Trust (a public benefit fund) • reductions for CCAs and exemptions for CHP and renewable energy sources
Climate Change Agreements • Energy efficiency agreements • 80% discount on Levy for meeting targets • Duration: 2001 to 2013 • Projected carbon savings of 2.5MtC by 2010 • Ten times the estimated price effect of the Levy alone • Actual savings • 2002 – target - performance 13.5 MtCO2 • 2004 – target - performance 14.4 MtCO2
European Union 25 countries in ETS 2 joined EU in 2007
European Union action: Emissions Trading Scheme (ETS) • 1998: EU Member States agree share-out of EU 8% Kyoto target. • EG -20% (Germany, Denmark), -12.5% (UK), • 2001: Legislation for ETS proposed; Member States (Council) + European Parliament reach agreement in 2003. • Why emissions trading ? • Least cost emissions reductions • certainty of environmental impact - through cap on emissions • New approach to environmental legislation to meet global challenge of climate change.
Key features of EU ETS • “Cap and trade” scheme covering CO2 emissions from combustion processes (approx 50% of EU CO2 emissions) • 1 European Union Allowance (EUA) = 1 metric tonne of CO2 • Allowances freely tradable throughout EU Member States • Majority of allowances allocated for free - range of methods, including historical emissions, projected emissions, sector benchmarks etc • limited use of offsets (Kyoto project credits)
Phase I – 2005 – 2007 – the learning phase • 25 Member States • Rushed timetable • Institutions in place • Trading begins • Results of first year released May 2006
Phase II – 2008 -2012 First Kyoto Commitment Period • 27 Member States • Rushed timetable • Real data to assess allocations • Commitment to scarcity • Limits on the use of offsets (CDM/JI) • Action on small installations • Management of market sensitive information • But … no change to the Directive
Comparison UK Plan Phase I vs Phase II (2) • The comparable Phase II cap: • represents around a 3% reduction on the Phase I cap • 13% below the estimate of emissions in 2005 (this estimate includes emissions from opt-outs) • 14% below EU ETS emissions in 2003 • 11% (29MtCO2) lower than BAU projection (the Phase I cap was set 8% below BAU projection) • puts UK on track to a 16.2% reduction in carbon dioxide emissions by 2010
Total Quantity of Allowances 277 275.5 272 89% of BAU 246 245 97% Ph I cap 237 86% of 2003
Allocation to Large Electricity Producers Auctioning NER Reduction of 29.3 mtCO2 5% of BAU 65% of BAU Projected BAU emissions Allocation to incumbents
EU allowance prices: phase 1 (2005-07) and phase 2 (2008-2012)
Wholesale Electricity prices Price rises of 70% in UK in 2005 (US 27%) Mostly due to gas price rises (65% in 2005 and 73% in 2006) in turn due to oil price rises (contractually linked) 25-30% of the rise in wholesale electricity due to ETS
Early successes • Functioning market was created against ambitious timetable, high level of compliance in year 1 (99%+) • Early evidence of behavioural impacts, much higher level of boardroom attention
What have we learned • Industry needs certainty – fixed future targets • Markets need scarcity • Scarcity needs good baseline data • Impacts on Environment – firms tend to respond – even when its not rational to do so! • Lack of harmonisation between states creates real and perceived competitive distortions
Competition – have participants closed shop and moved to China • Programme only running 2 years • Not all sectors subject to international competition • Iron and steel - yes • Electricity generation – no • Some sectors can pass through costs • Carbon Price only one of a number of factors • Proximity to markets • Transportation costs • Skilled labour force
Latest developments • Climate Change Programme • Stern Review • Energy White Paper • Climate Change Bill • European Union Spring Council Conclusions • The Review of the ETS Directive
Stern Review: “The economics of climate change” • October 2006: Stern Report published • Key messages: • Urgency - benefits of strong early action outweigh costs of inaction • Mitigation = investment • Poorest countries and people will suffer earliest and most • Growth v. tackling climate change is a false choice • Prices need to reflect climate change impacts –through taxes, regulation, or trading. Trading likely to be the best way of securing an international carbon price.
The Climate Change Bill is designed to help us move to the kind of competitive low carbon economy required to meet the global challenge Committee on Climate Change Budgets • Long term statutory targets: • 60% by 2050 • 26-32% by 2020 • Five year carbon budgets to set out our trajectory Independent body to advise Government on its carbon budgets and where savings could come from Reporting Enabling Powers The Committee on Climate Change will have a duty to report annually on progress to Parliament Enabling powers to introduce new emissions trading schemes through secondary legislation
Spring EU Council Conclusions • Reduce to 20% below 1990 levels by 2020; and a 30% reduction in greenhouse gas emissions by 2020 compared to 1990 provided that other developed countries commit themselves to comparable emission reductions
Priorities for the EU ETS Review • The Commission has set out four priorities for the Review The Scope of the Directive Harmonisation and Predictability Feasibility of including N2O, Coal mine methane, expansion to aluminium sector, and others. Treatment of CCS, small installations. Approval of EU projects Single EU cap vs national caps, sector specific allocation, use of projections, auctioning, benchmarking, new entrants and closures, reporting to markets Linking to other Schemes Compliance and Enforcement Regulation of Monitoring and Reporting; community level verfication, further harmonisation Design of 3rd Country Schemes Recognition at regional level Efficacy of JI and CDM Community authorisation of projects Harmonised limits on use of project credits
Contact Jill Duggan Head of International Emissions Trading Climate and Energy: Business and Transport UK Department for Environment, Food and Rural Affairs jill.duggan@defra.gsi.gov.uk http://www.defra.gov.uk/