1 / 0

Access Reports

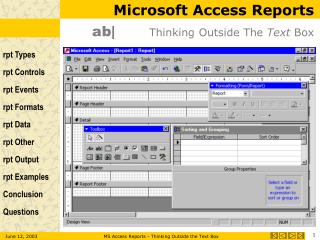
Access Reports. Building and Printing Reports. Reports provide the mechanism to produce high quality printed output of database information Reports are strictly for output; data cannot be altered through a report interface Reports are based on information found in tables and queries.

nerice
Download Presentation

Access Reports

An Image/Link below is provided (as is) to download presentation Download Policy: Content on the Website is provided to you AS IS for your information and personal use and may not be sold / licensed / shared on other websites without getting consent from its author. Content is provided to you AS IS for your information and personal use only. Download presentation by click this link. While downloading, if for some reason you are not able to download a presentation, the publisher may have deleted the file from their server. During download, if you can't get a presentation, the file might be deleted by the publisher.

E N D

Presentation Transcript


  1. Access Reports

  2. Building and Printing Reports Reports provide the mechanism to produce high quality printed output of database information Reports are strictly for output; data cannot be altered through a report interface Reports are based on information found in tables and queries
  3. Using Reports Reports allow you to group related information from one or more tables Reports provide hard copy output that summarizes and subtotals data found in the database Reports can produce mailing labels on standard label maker forms in postal code order to reduce mailing costs
  4. Using Report Wizards You can create reports from scratch using a blank form, or you can enlist the help of the Report Wizard Report Wizards offer several styles of reports including: Columnar AutoReport Tabular AutoReport Chart Wizard and Labels Wizard
  5. 2K7 Wizard Select create tab Select report wizard Select data sources and attributes from each source Source can be table(s) or query Select grouping if needed Sort order if desired Layout Style Report Name
  6. Select create tab Select report wizard
  7. Select data sources and attributes from each source
  8. Groupings
  9. Sort order
  10. Layout
  11. Style
  12. Name report
  13. Report created with wizard
  14. Modifying Report Go to design view to modify reports Design view will show you the sections of the report Header sections Detail section Footer sections Highlight field Right click Select properties
  15. Books by Year Report
  16. Book by Year report Design View
  17. Report Header Page Header Group Header Detail section Group Footer Page Footer Report Footer
  18. Group Header Detail section Group Footer
  19. Report sections Report Header appears once at the beginning of a report Page Header appears on every page Group Header appears at the beginning of each new group prior to the first detail line for that group Detail (required section) prints data for each record from the database
  20. Report sections Group Footer prints group information when the grouping field changes and appears just before the first detail line of the next group Page Footer appears at the bottom of each page Report Footer appears once at the end of a report
  21. Reports based on Multiple Tables Report Wizard produces a report based on more than one table by creating a “behind the report” query one that is not stored in the Queries collection Producing a report with a hidden query may preferable when the query supplying the data does not have widespread, stand-alone applicability
  22. Example Report Source Northwind database Products by category Source tables Category table Product table
  23. Category Table Products Table
  24. Attribute Selection
  25. View of Data Records(rows) are grouped by this field
  26. Name Report
  27. Results
  28. Design View
  29. Highlight here and Right click here to get property sheet To see query that report is based on, click here
  30. Query Generated for report Query Builder Not a saved query
  31. Building Reports with Queries and Expressions Invoice example Query must be created to select invoice fields that you would want in report Query must create extended total for each line item Report will pull items from this query Creating a simple invoice report is easy If using the report wizard, initial wizard design will probably need to be changed Pain is modifying the design to suit your needs
  32. Final Version of Invoice Report
  33. Query Used for Invoice Report Saved query to be used by report
  34. Summary option will give us the subtotal
  35. Expression created by wizard to calculate subtotal
  36. Creating a calculated control The Invoice subtotal and the grand total on the invoice are examples of calculated controls Usually, text boxes are used for the creation of calculated controls
  37. Calculated text box Open the form or report in Design view by right-clicking the form or report in the Navigation Pane, and then clicking Design View. On the Design tab, in the Controls group, click Text Box. Position the pointer where you want the text box to be placed on the form or report, and then click to insert the text box.
  38. Do one of the following: Place the cursor in the text box, and then type an expression that calculates a total. Select the text box, press F4 or right click to display the property sheet, and type the expression in the Control Source property box. To use the Expression Builder to create the expression, click next to the Control Source property box.
  39. Text Box
  40. To use the Expression Builder to create the expression, click next to the Control Source property box
  41. Office 2K3 Once you select design or wizard, procedures mirror 2K7 Select Design or Wizard
More Related