Download
1 / 22
220 likes | 1.03k Views
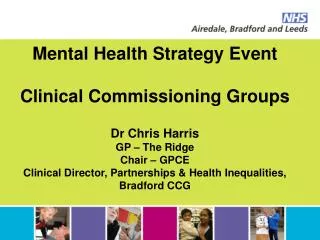
Commissioning to reduce health inequalities: Supporting analysis. Ester Romeri Dilwyn Sheers Health Inequalities National Support Team Department of Health. Outline. What needs to be done to improve health and reduce inequalities?

E N D
Commissioning to reduce health inequalities:Supporting analysis Ester Romeri Dilwyn Sheers Health Inequalities National Support Team Department of Health
Outline Whatneeds to be done to improve health and reduce inequalities? • Set and quantify ambitions based on peers’ best performance (e.g. Number of deaths to prevent) Wheredoes the problem lie? • Identify ‘excess’ deaths by cause and age (where gains can be made, e.g. CHD mortality in the over 75s?) Howto understand health needs in local population? • Identify variation in primary care performance and impact on mortality (e.g. Number of patients with pre-existing CHD but untreated) Way forward ‘modelling the numbers’ • Quantify the contribution of systematic and selected evidence based interventions needed to achieve the challenge (e.g. Oldham’s ambition)
Setting Ambitions: Best in Peer Group (Males) Male All Age All Cause Mortality (AAACM) Rates by GP Consortia, 2007-09 Oldham South Birmingham *Peer group = Former Spearhead PCTs in ‘Centres with Industry’ ONS area classification
Estimating the scale of the challenge (Males) Oldham Male AAACM rate 2001-2009, forecast and trajectory to 2013-15 ambition 270 fewer deaths in 2013-15 expected based on current trend Equivalent to 417 (13%) fewer male deaths in 2013-15
Setting Ambitions: Best in Peer Group (Females) Female All Age All Cause Mortality (AAACM) Rates by GP Consortia, 2007-09 Oldham Walsall *Peer group = Former Spearhead PCTs in ‘Centres with Industry’ ONS area classification
Estimating the scale of the challenge (Females) Oldham Female AAACM rate 2001-2009, forecast and trajectory to 2013-15 ambition 297 fewer deaths in 2013-15 expected based on current trend Equivalent to 636 (17%) fewer female deaths in 2013-15
Estimating the scale of the challenge : Summary Reductions in mortality numbers necessary to meet 2013-15 targets
Identifying ‘excess’ mortality by age group Source: Derived from London Public Health Observatory Health Inequalities Intervention Tool data
Identifying ‘excess’ mortality by cause Females Males Source: Derived from NCHOD standardised mortality ratios (SMR) and mortality numbers by age and cause. Excess mortality = ‘observed’ minus ‘expected’ deaths
Identifying Primary Care performance to outcomes QOF registered prevalence and CHD Mortality(<75)in Oldham (MSOAs)
Index of Multiple Deprivation (2007) Most deprived areas in Oldham (darker areas)
Identifying the untreated patients (GP practice) CHD: Expected vs QOF Registered Prevalence (Percentage)A quarter of patients with a history of CHD are estimated undiagnosed (untreated)
Identifying the untreated patients (GP practice) CHD: Expected vs QOF Registered Prevalence (Number)
Identifying the untreated patients (GP practice) Hypertension: Expected vs QOF Registered Prevalence (Percentage)More than half patients with Hypertension are estimated undiagnosed (untreated)
Identifying the untreated patients (GP practice) Hypertension: Expected vs QOF Registered Prevalence (Number)
Identifying the untreated patients (GP practice) COPD: Expected vs QOF Registered Prevalence (Percentage)On average half of patients with COPD are estimated undiagnosed (untreated)
Identifying the untreated patients (GP practice) COPD: Expected vs QOF Registered Prevalence (Number)
Potential impact of evidence-based interventions on reducing mortality numbers NNT = Number Needed to Treat to postpone one death
Using the model: a worked example (1) Aim: Deliver a short-term plan to place the PCT on a target AAACM trajectory for males The Plan:Focus on six evidence based interventions: • Full implementation of evidence based treatments for patients with CVD who are currently untreated • Full implementation of evidence based treatments for patients with CVD who are currently partially treated • Finding and treating undiagnosed hypertensives • Moving patients on Atrial Fibrillation registers from aspirin to warfarin • Statins to address CVD risk among COPD patients. • Reducing blood sugar in diabetic patients Expected Outcomes • Improved management of primary and secondary prevention of CVD • Postponement of up to 257 deaths from CVD if the interventions are fully implemented, although this would depend on pace of incremental delivery • Achieving 38% of full implementation of all interventions would deliver the AAACM target although again this depends on pace of incremental delivery Source: Rochdale PCT AAACM Recovery Plan, Nov 2010
Using the model: a worked example (2) • Intervention: • Moving patients over 65 years on AF registers from aspirin to warfarin • Evidence Base: Evidence shows Warfarin reduces stroke among AF patients by 64%, compared with 22% for aspirin • Treatment population: • Local audit identified 887 (45%) of AF patients eligible (46% already on Warfarin, 9% contraindicated). Compared with estimate of 587 in the model • Outcomes: • Estimated 24 stroke deaths prevented. (By applying model’s NNT ratio of 37 to 887 patients).Compared with estimate of 16 deaths prevented in the model • Costs: • Recurrent costs of £348,000 (Additional cost of prescribing plus additional referrals to the anticoagulation Service)
Using the model: a worked example (3) • Intervention: • Statins to address CVD risk among patients with mild or moderate COPD • Evidence Base: Observational studies show CVD is the leading cause of mortality among patients with mild and moderate COPD, yet CVD risk is often untreated among this patient group • Treatment population: • Aim to increase coverage from 26% to 66% of all COPD patients. (Current treatment coverage of 26% estimated from local audit of COPD registers plus estimate of undiagnosed COPD from APHO prevalence estimate.) Equates to an additional 2,450 COPD patients on a statin • Outcomes: • Estimated 55 deaths prevented(consistent with model which shows effect of additional 40% COPD patients on a statin) • Costs: • Recurrent costs of £95,000 (includes finding additional patients)
Prescribing costs versus outcomes (see HINST ‘How-to’ Guide @ www.dh.gov.uk/HINST ) Prescribing costs versus outcomes • Fig 7a - Prescribing Costs per Diabetic Pt (Apr 06-Mar 07) v Percentage of diabetic patients whose HbA1C • has been 7.4 or less in the last 15 months (Apr 06-Mar 07) • 80 • Higher % pts at target - Low prescribing • Higher % pts at target - High prescribing • 25 • 75 • 70 • 21 • 17 • 65 • 13 • 1 • 14 • 28 • 30 • 6 • % target met • 60 • 5 • 26 • 22 • 55 • 23 • 29 • 19 • 16 • 32 • 33 • 50 • 4 • 2 • 20 • 7 • 10 • 15 • 45 • 8 • 24 • 27 • 12 • 31 • 9 • 40 • 11 • 3 • 18 • 35 • Lower % pts at target - Low prescribing • Lower % pts at target - High prescribing • 30 • £150 • £200 • £250 • £300 • £350 • £400 • £450 • NIC (£) per diabetic patient