Download
1 / 1
20 likes | 219 Views
Development and Application of MRI & PET Methods for Predicting Therapeutic Response of Breast Cancers During Neoadjuvant Chemotherapy. Xia Li, Lori R. Arlinghaus, Richard G. Abramson, A. Bapsi Chakravarthy, Vandana G. Abramson,

E N D
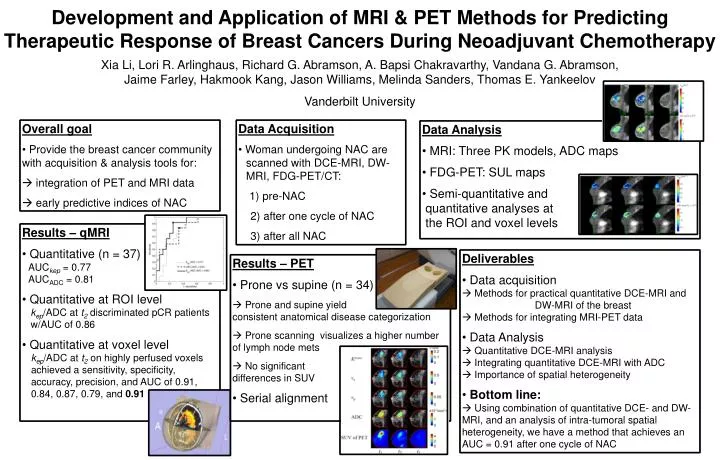
Development and Application of MRI & PET Methods for Predicting Therapeutic Response of Breast Cancers During Neoadjuvant Chemotherapy Xia Li, Lori R. Arlinghaus, Richard G. Abramson, A. Bapsi Chakravarthy, Vandana G. Abramson, Jaime Farley, Hakmook Kang, Jason Williams, Melinda Sanders, Thomas E. Yankeelov Vanderbilt University • Overall goal • Provide the breast cancer community with acquisition & analysis tools for: • integration of PET and MRI data • early predictive indices of NAC • Data Acquisition • Woman undergoing NAC are scanned with DCE-MRI, DW- MRI, FDG-PET/CT: • pre-NAC • 2) after one cycle of NAC • 3) after all NAC • Data Analysis • MRI: Three PK models, ADC maps • FDG-PET: SUL maps • Semi-quantitative and • quantitative analyses at • the ROI and voxel levels • Results – qMRI • Quantitative (n = 37) • AUCkep = 0.77 • AUCADC = 0.81 • Quantitative at ROI level • kep/ADC at t2 discriminated pCR patients w/AUC of 0.86 • Quantitative at voxel level • kep/ADC at t2 on highly perfusedvoxels achieved a sensitivity, specificity, accuracy, precision, and AUC of 0.91, 0.84, 0.87, 0.79, and 0.91 • Deliverables • Data acquisition • Methods for practical quantitative DCE-MRI and DW-MRI of the breast • Methods for integrating MRI-PET data • Data Analysis • Quantitative DCE-MRI analysis • Integrating quantitative DCE-MRI with ADC • Importance of spatial heterogeneity • Bottom line: • Using combination of quantitative DCE- and DW-MRI, and an analysis of intra-tumoralspatial heterogeneity, we have a method that achieves an AUC = 0.91 after one cycle of NAC • Results – PET • Prone vs supine (n = 34) • Prone and supine yield • consistent anatomical disease categorization • Prone scanning visualizes a higher number of lymph node mets • No significant • differences in SUV • Serial alignment