Download
1 / 16
160 likes | 309 Views
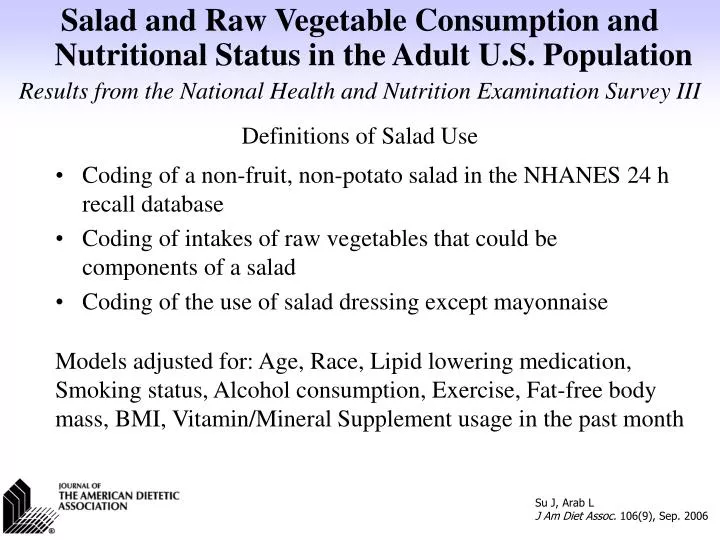
Salad and Raw Vegetable Consumption and Nutritional Status in the Adult U.S. Population Results from the National Health and Nutrition Examination Survey III. Su J, Arab L J Am Diet Assoc. 106(9), Sep. 2006. Definitions of Salad Use.

E N D
Salad and Raw Vegetable Consumption andNutritional Status in the Adult U.S. Population Results from the National Health and Nutrition Examination Survey III Su J, Arab L J Am Diet Assoc. 106(9), Sep. 2006 Definitions of Salad Use • Coding of a non-fruit, non-potato salad in the NHANES 24 h recall database • Coding of intakes of raw vegetables that could be components of a salad • Coding of the use of salad dressing except mayonnaise Models adjusted for: Age, Race, Lipid lowering medication, Smoking status, Alcohol consumption, Exercise, Fat-free body mass, BMI, Vitamin/Mineral Supplement usage in the past month
Salad and Raw Vegetable Consumption andNutritional Status in the Adult U.S. Population Results from the National Health and Nutrition Examination Survey III Age 18-45 years Age 55+ Years Women n = 5,392 Men n =4,693 Women n = 4,014 Men n = 3,589 Total n Mean age in years (Standard Deviation) 31.0 (7.9) 30.8 (7.9) 71.1 (9.7) 70.4 (9.4) Caucasian n (%) 3,287 (61%) 2,949 (63%) 3,119 (78%) 2,771 (77%) African American n (%) 1,897 (35%) 1,528 (33%) 823 (21%) 733 (21%) Other n (%) 208 ( 3.9%) 216 ( 4.6%) 72 (1.8%) 85 (2.4%) Su J, Arab L J Am Diet Assoc. 106(9), Sep. 2006 Sociodemographic Characteristics of NHANES III
Salad and Raw Vegetable Consumption andNutritional Status in the Adult U.S. Population Results from the National Health and Nutrition Examination Survey III Su J, Arab L J Am Diet Assoc. 106(9), Sep. 2006 Salad Consumption in Men and Women by Race (% of Consumers) Women 18-45 Women 55+ Men 18-45 Men 55+ All 35% 31% 33% 30% Caucasian 39% 34% 36% 33% African 27% 18% 26% 19% American p-value* 0.17 < 0.01 0.17 0.03 * p-values reflect the ANOVA values for differences between races
Salad and Raw Vegetable Consumption andNutritional Status in the Adult U.S. Population Results from the National Health and Nutrition Examination Survey III Su J, Arab L J Am Diet Assoc. 106(9), Sep. 2006 Mean Intakes (grams/day)* of Salad in Men and Women by Age and Race
Salad and Raw Vegetable Consumption andNutritional Status in the Adult U.S. Population Results from the National Health and Nutrition Examination Survey III Su J, Arab L J Am Diet Assoc. 106(9), Sep. 2006 Median Intakes (grams/day)* of Salad in Men and Women by Age and Race
Salad and Raw Vegetable Consumption andNutritional Status in the Adult U.S. Population Results from the National Health and Nutrition Examination Survey III P <0.01 p-value reflects the probability of these differences occurring by chance across the three levels, using ANOVA testing for differences Su J, Arab L J Am Diet Assoc. 106(9), Sep. 2006 Serum Folate (ng/ml) by Salad Intake Serum Folate (ng/ml) Average Salad Consumption (per day)
Salad and Raw Vegetable Consumption andNutritional Status in the Adult U.S. Population Results from the National Health and Nutrition Examination Survey III P <0.01 p-value reflects the probability of these differences occurring by chance across the three levels, using ANOVA testing for differences Su J, Arab L J Am Diet Assoc. 106(9), Sep. 2006 Red Cell Folate (ng/ml) by Salad Intake Red Cell Folate (ng/ml) Average Salad Consumption (per day)
Salad and Raw Vegetable Consumption andNutritional Status in the Adult U.S. Population Results from the National Health and Nutrition Examination Survey III P <0.01 p-value reflects the probability of these differences occurring by chance across the three levels, using ANOVA testing for differences Su J, Arab L J Am Diet Assoc. 106(9), Sep. 2006 Serum Vitamin C (mg/dl) by Salad Intake Serum Vitamin C (mg/dl) Average Salad Consumption (per day)
Salad and Raw Vegetable Consumption andNutritional Status in the Adult U.S. Population Results from the National Health and Nutrition Examination Survey III P <0.01 p-value reflects the probability of these differences occurring by chance across the three levels, using ANOVA testing for differences Su J, Arab L J Am Diet Assoc. 106(9), Sep. 2006 Serum Vitamin E (mg/dl) by Salad Intake Serum Vitamin E (mg/dl) Average Salad Consumption (per day)
Salad and Raw Vegetable Consumption andNutritional Status in the Adult U.S. Population Results from the National Health and Nutrition Examination Survey III P <0.01 p-value reflects the probability of these differences occurring by chance across the three levels, using ANOVA testing for differences Su J, Arab L J Am Diet Assoc. 106(9), Sep. 2006 Beta Carotene (ug/dl) by Salad Intake Beta Carotene (ug/dl) Average Salad Consumption (per day)
Salad and Raw Vegetable Consumption andNutritional Status in the Adult U.S. Population Results from the National Health and Nutrition Examination Survey III P <0.01 p-value reflects the probability of these differences occurring by chance across the three levels, using ANOVA testing for differences Su J, Arab L J Am Diet Assoc. 106(9), Sep. 2006 Alpha Carotene (ug/dl) by Salad Intake Alpha Carotene (ug/dl) Average Salad Consumption (per day)
Salad and Raw Vegetable Consumption andNutritional Status in the Adult U.S. Population Results from the National Health and Nutrition Examination Survey III P <0.01 p-value reflects the probability of these differences occurring by chance across the three levels, using ANOVA testing for differences Su J, Arab L J Am Diet Assoc. 106(9), Sep. 2006 Lycopene (ug/dl) by Salad Intake Lycopene (ug/dl) Average Salad Consumption (per day)
Salad and Raw Vegetable Consumption andNutritional Status in the Adult U.S. Population Results from the National Health and Nutrition Examination Survey III Su J, Arab L J Am Diet Assoc. 106(9), Sep. 2006 Relative Risk (RR and Confidence Interval, CI) of Exceeding Recommendations by Salad Consumption Women (per 90g salad) RR CI Vitamin C > 60 mg/day 2.65 (2.35, 2.99) Vitamin E > 12 TE/day 1.47 (1.39, 1.56) Vitamin B6 > 1.1 mg/day 1.73 (1.57, 1.90) Folate > 320 mcg/day 1.41 (1.34, 1.50) Men Vitamin C > 75 mg/day 2.19 (1.98, 2.41) Vitamin E > 12 TE/day 1.53 (1.45, 1.62) Vitamin B6 > 1.1 mg/day 2.86 (2.24, 3.65) Folate > 320 mcg/day 1.48 (1.40, 1.56)
Salad and Raw Vegetable Consumption andNutritional Status in the Adult U.S. Population Results from the National Health and Nutrition Examination Survey III Su J, Arab L J Am Diet Assoc. 106(9), Sep. 2006 Relative Risk (RR and Confidence Interval, CI) of Exceeding Recommendations by Dressing Consumption Women (per 30g dressing) RR CI Vitamin C > 60 mg/day 2.08 (1.69, 2.55) Vitamin E > 12 TE/day 1.83 (1.66, 2.02) Vitamin B6 > 1.1 mg/day 1.45 (1.23, 1.70) Folate > 320 mcg/day 1.30 (1.17, 1.45) Men Vitamin C > 75 mg/day 1.59 (1.39, 1.82) Vitamin E > 12 TE/day 1.96 (1.78, 2.17) Vitamin B6 > 1.1 mg/day 1.87 (1.33, 2.62) Folate > 320 mcg/day 1.38 (1.27, 1.52)
Salad and Raw Vegetable Consumption andNutritional Status in the Adult U.S. Population Results from the National Health and Nutrition Examination Survey III (1988-1994) Su J, Arab L J Am Diet Assoc. 106(9), Sep. 2006 Summary of Results • Consumption of salads, raw vegetables and salad dressing were positively associated with above median serum micronutrient levels of folic acid, vitamins C and E, lycopene and alpha and beta-carotene. • Each serving of salad consumed was associated with a 165% higher likelihood of meeting the recommended RDA for vitamin C in women and 119% greater likelihood in men.
Salad and Raw Vegetable Consumption andNutritional Status in the Adult U.S. Population Results from the National Health and Nutrition Examination Survey III Su J, Arab L J Am Diet Assoc. 106(9), Sep. 2006 Conclusions regarding Nutrient Adequacy • Salad consumers have more favorable intakes of vitamin C, E, folic acid and carotenoids, after adjustment for other differences. • Significant and consistently higher serum values of these vitamins suggest that they are being well absorbed from salad. • Salad, salad dressing and raw vegetable consumption can be an effective strategy for enhancing nutritional adequacy and increasing vegetable consumption in the population at large