Download
1 / 35
350 likes | 441 Views
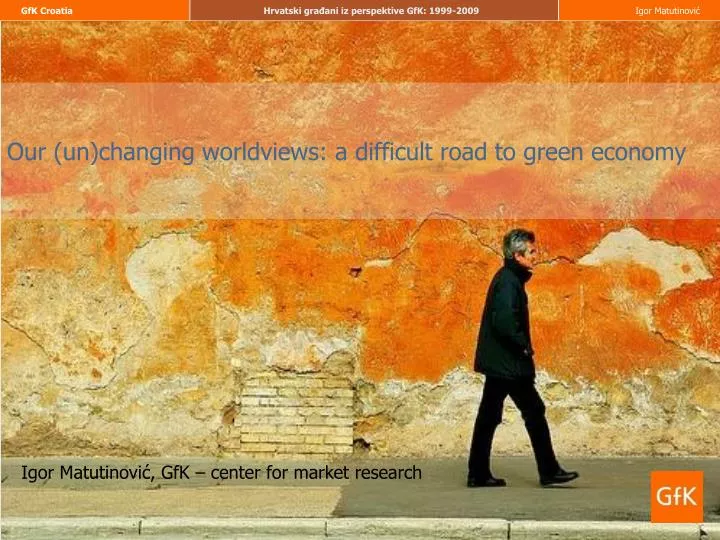
Our (un)changing worldviews: a difficult road to green economy. NASLOVI, DATUMI. Hrvatski građani iz perspektive GfK: 2000-2009. TU BI MORALA BITI 1999 GODINA, A NE 2000. Igor Matutinović, GfK – center for market research. Problem setting and theoretical fra m ework Empirical analysis

E N D
Our (un)changing worldviews: a difficult road to green economy NASLOVI, DATUMI... Hrvatski građani iz perspektive GfK: 2000-2009 TU BI MORALA BITI 1999 GODINA, A NE 2000 Igor Matutinović, GfK – center for market research
Problem setting and theoretical framework Empirical analysis Conclusions
How are our economies currently “designed”? Generate enormous amounts of waste. Put millions of tons of toxic materials in water, soil and in atmosphere. Produce some materials so dangerous they will require constant vigilance by future generations. Burry down irretrievably valuable materials on the planetary level. Require complicated and numerous regulations which does not preserve the health of people and ecosystems but only slows down the poisoning dynamics. Erode diversity species and cultural practices. Source: McDonough i Braungart (2002)
What drives great transitions? Urban transport in China in the 1980 and in 2010. Carbon free Energy efficient Pollutants free Healthy
Higher level Boundary conditions Institutions Economic process Focal level Firms and households Initial conditions Lower level
Higher level Boundary conditions Capitalist Institutions Economic growth Focal level Firms and households Initial conditions Lower level
L +2 Worldview L + 1 Institutions Economic behavior Level in focus L-1 Firms and households
Values and priorities in life and business Consumers: global, US, EU, CEE Opnion polls Three perspectives Business leaders: global Policy makers Desk research: how they commit public resources
Global consumer perspective: GfK Roper Green Gauge Global 11 Global comparable view of consumersin 25+ markets 2010: 37,211 consumers, 15+ USA Canada Argentina Brazil Mexico France Germany Italy Spain Sweden Turkey UK Czech Republic Poland Romania Russia Egypt South Africa Australia China India Indonesia Japan South Korea Taiwan Thailand
Top 10 Global concerns: Green rising 12 +1 +1 Recession & unemployment Inflation & high prices Enough money to live right and pay the bills Crime and lawlessness Environmental pollution Educational quality Cost of healthcare Wrongdoing by/corruption of elected government officials The future of the retirement or pension plan provided by our government Global climate change/global warming
Not just about money: top 3 concerns Environmental pollution Global climate change/Global warming 13 “Which 3 things are you personally most concerned about today?” Roper Reports Worldwide 2010 (mixed-mode trend, core 25 countries), A 25% 15%
Environmental pollution 14 Roper Reports Worldwide 2010 (mixed-mode trend, core 25 countries)
Being in Tune with Nature Ranked 37th (of 54) in 2010 Fitting into nature Overall Importance of Value • Rank range • Ranked from 19th to 47th Globally • Highest in India • Lowest in Indonesia Key Demographics (index: total pop=100) Roper Reports Worldwide 2010 (Global mixed mode, core 25 countries)
Preserving the Environment Ranked 27th (of 54) in 2010 Helping to preserve nature Overall Importance of Value • Rank range • Ranked from 8th to 39th Globally • Highest in Brazil • Lowest in South Africa, Taiwan Key Demographics (index: total pop=100) Roper Reports Worldwide 2010 (Global mixed mode, core 25 countries)
% who take the environment into account when making purchase decisions (top 2 box) Focus on Purchasing Green Products Will Have Viability in Most Markets Globally, 30%Take the environment into account when making purchase decisions all or most of the time.
New product launches that were green 19 Global new products with environmentally friendly product and/or packaging claims 2010 2009 8% 12% Source: Industry sources
% who recycle (top 2 box) Focus on RecyclingRecycling Varies Widely By Region Most Likely Due to Access Globally,56%recycle (paper, glass, plastics, metals, etc.)all or most of the time.However, this number varies widely by region. In developed markets a vast majority of consumers engage in recycling – one of the easiest green behaviors due to government regulation.
We really do... recycle? Great Pacific Garbage Patch ½ to ¾ of material resources that enter economic process is returned to environment as waste in the course of 1 year! (Matthews, 2000) Area twice the size of Texas!
Developed Developing Focus on Economics vs the EnvironmentThe Economy Still Weighs Heavy in the Minds of Many Consumers Want Responsibility, But Not at the Expense of Development! Globally, 49%say “First comes economic security and well- being, then we can worry about environmental problems” (agree strongly/somewhat) +2 pts from 2009. The Increases are Generally in the Developed World, which has been harder hit by the global recession. Roper Reports Worldwide 2010 (mixed mode short trends, core 25 countries). QF3
Consumer perspective: USA 23 Source: USA Today/Gallup Poll. May 24-25, 2010. N=1,049 adults nationwide. MoE ± 4
Consumer perspective: USA 24 Which is more important to you as you think about increasing drilling for oil and gas in coastal areas around the United States? The need for the U.S. to provide its own sources of energy. The need to protect the environment”. AP-GfK Poll conducted by GfK Roper Public Affairs & Media. Aug. 11-16, 2010. N=1,007 adults nationwide. MoE ± 4.5. Just prior to the spill 70% of registered voters favored increasing offshore drilling for oil and gas in U.S. coastal areas! FOX News/Opinion Dynamics Poll. June 8-9, 2010. N=900 registered voters nationwide. MoE ± 3.
Give us green or any other energy ... providing it is cheap!
In fact, we want it all! Source: Pew Research/National Journal Congressional Connection Poll, sponsored by the Society for Human Resource Management. July 29-Aug. 1, 2010. N=1,003 adults nationwide. MoE ± 4.
European Union: attitudes towards the environment in 2007 Source: Eurobarometer 2008
European Union: attitudes towards the environment Trivial efforts Substantial efforts Source: Eurobarometer 2008
European Union: attitudes towards the environment We are worried about effects but much less about causes! Source: Eurobarometer 2008
Consumer attitudes and practices: a wrap-up 1. We are not quite there yet to embrace the green paradigm and life-styles. “Ready to save the world - but not yet” 2. Our efforts are mostly of palitive nature and trivial in its effects on environment. We did not start yet to question seriously our consumption habits and life-styles! 3. Demand for green products and services is still confined to a niche. Do not expect green “revolution” in the post-recession period! Our worldview has not changed yet....
The opinion of business leaders on sustainability issues Weak pull strenght from the market! The survey was conducted in February 2010 and received responses from 1,946 executives representing a wide range of industries and regions. Source: McKinsey Global Survey How companies manage sustainability, 2010.
Where sustainability matters? Weak direct effect on environment ! Sustainability is mostly about corporate reputation and “strategy”!
The revealed attitudes of policy makers The US stimulus package: $789 billion out of which 35 billion for clean and efficient energy 18.8 billion for protection for water and environment. In total: 53.8 billion or 6.8%. Reduction of subsidies for solar energy (feed-in tariffs): Spain, Italy,Germany, UK, vs. large stimulus to car industry for “cash for clunkers program” in Europe and in the US. Military expenditure of USA as % of GDP 2002 2003 2004 2005 2006 2007 2008 3.4 3.8 4 4 3.9 4 4.3 “In the past two decades, funding for energy R&D has fallen” Nature, 2006, 443:1. Global military expenditure in 2009 = +6% ≈$1,531 billion (2.7% of global GDP) +49% since 2000. SIPRI, 2010 (http://milexdata.sipri.org/result.php4)
Consumer demand and industry supply are not showing signs of substantial shift towards greener economy. Shift away from materialistic values and growth obsession Preference for high and stable energy prices L +2 Worldview “Green” government funding and subsidies and procurement policy Oil tax L + 1 Institutions Economic behavior Level in focus Greening the economy Change in production and investment policy Substantial change in life-styles L-1 Firms and households