Download
1 / 12
120 likes | 303 Views
Kinetics of a Chemical Reaction. The Ferrimyoglobin – Fluoride Reaction. Background.

E N D
Kinetics of a Chemical Reaction The Ferrimyoglobin – Fluoride Reaction
Background Ferrimyoglobin is the protein that “stores” oxygen. The 153 amino acids that comprise it hold a porphyrin ring system that is the active site of the protein. The porphyrin ring complexes a ferric ion held in the center of the ring. This ion binds O2 by complexing but it can readily complex with many other chemical species but with widely differing rates and binding energies.
The iron carries a net charge of +1and has a free ligand site usually coordinated with a water molecule. Anions bind strongly with the iron and can displace weak ligands. Fluoride ion binds particularly well according to: Fe+(H2O) + F- Fe-F + H2O
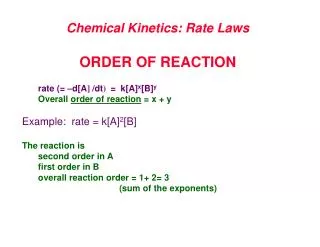
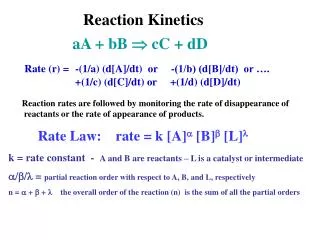
Where the Fe-F is the ferrimyglobin fluroide, a high-spin complex. The rate of formation of the Fe-F is given by: -d[ Fe+(H2O) ] = kf [Fe+][F-] – kb[Fe-F] dt For high fluoride concentrations, the integrated rate law is:
The Fe-F is intensely colored and allows the reaction to be followed by optical absorption at 608nm. Thus Beer’s Law can be used. It can be shown that a plot of ln( Ae – A ) vs. time will be linear with a slope equal to the term in parenthesis in the rhs of the last equation. Ae -absorbance at equilibrium A – absorbance at time, t Repetition of the experiment with different initial [F-] will generate a series of lines of different slope. A plot of the slopes of these lines against [F-] will also be linear and will give kb as the intercept and kf as the slope.
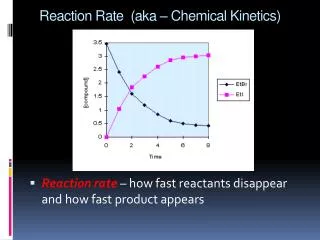
Equilibrium may be described as the condition when the forward rate of a reaction is exactly equal to the reverse rate. This allows calculation of the “kinetic” equilibrium constant. Keq = kf /kb The experimental data obtained at equilibrium provides an alternative measurement of the equilibrium constant: Ao- absorbance of ferrimyoglobin solution before reaction A100 – absorbance of totally reacted Fe-F
Objective The goal of the experiment is to obtain the forward and reverse rate constants for the ferrimyoglobin reaction with fluoride ion. The “kinetic” equilibrium constant will be obtained from these constants and compared to the equilibrium constant obtained by measurement at complete reaction (equilibrium).
Procedure • Stock solutions of KCl, KF and ferrimyoglobin will be provided • Record concentrations of all soluitons • Obtain burets, pipetts, cuvettes and timer • Measurements will be made on a spectrophotometer set to 608nm. • Place cuvette filled with distilled water in reference compartment.
Mix 3.0 mL of ferrimyoglobin and 1.5 mL of KCl solution in the sample cuvette. • Inject 0.5mL of KF solution into the cuvette and start timer with injection. • Mix the solution using a small glass rod. • Close cell chamber and record absorbances at 5 s intervals. • Early readings are important • Equilibrium will obtain in 2-3 min (no change in absorbance) and this will give Aeq
Equilibrium solution may have a greenish tint. • Repeat measurements for seven other reactant solutions • All must have same amount of ferrimyoglobin (3.0 mL) • Volumes of KCl and KF may be varied. • Total volume must always be 5 mL. • An individual run should take about 5 min.
Data Analysis • Plot ln(Ae – A) vs. time for each run. • Use only first few points to get slope • A least squares fit of this data will give Ao as will the absorbance measured before injection of the KF solution corrected by KCl solution. • Plot slopes of each run vs. [F-] • Obtain slope of this linear plot. • Determine kf from the slope and kb from the intercept.
Calculate the kinetic equilibrium constant from the forward and reverse rate constants. • Calculate the thermodynamic equilibrium constant for each run. • Make table of Ao, Ae, A100, and K for each run. • [Fe-F] = (Ae – Ao) • [Fe+] = (A100 – Ao) • Calculate average K with error.