Download
1 / 39
390 likes | 522 Views
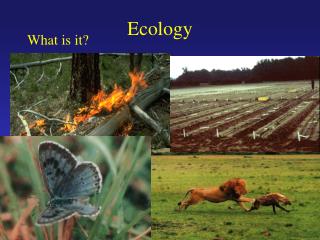
Ecology. Studying populations in their environments. What is an ecosytem. Biotic factors Plants Animals (including insects) Abiotic factors Atmosphere (inc rain temp wind light) Soil (esp fertility, and temp drainage etc) Water (rainfall, nutrients, water table). Habitats.

E N D
Ecology Studying populations in their environments
What is an ecosytem • Biotic factors • Plants • Animals (including insects) • Abiotic factors • Atmosphere (inc rain temp wind light) • Soil (esp fertility, and temp drainage etc) • Water (rainfall, nutrients, water table)
Habitats • Habitats are the places where an organism can live • Some organisms have very specific habitat requirements eg Kakapo cannot reproduce without access to rimu fruit. Human hair lice (kooties) need humans to survive. Some orchids need a particular moth to pollinate them
Ecological niche • Ecological niche is an interaction of resource use, environment and activity time (eg nocturnal) • Fundamental niche is the full range of environmental conditions (biotic and abiotic) that an organism can live in • Realised niche is the place where the organism actually exists and is where they are most highly adapted to. This is where they outcompete all other species
Populations (biotic) • You measure populations • Density • Distribution • Survivorship curves • Age structure • Population growth curves (natality/mortality) • All this information will give you an idea of what is going on
Density and distribution • Density • A measure of how many individuals/area • Low density in tigers and rhinos • High density in corals and termites • Distribution • Random for some plants (quite a rare pattern) • Clumped in herding/social animals (fish schools) • Uniform (nesting gannets, rhino)
Population regulation • Biotic and abiotic factors control the size of populations • Abiotic factors may influence food supply which is biotic • Abiotic factors can be steady like rainfall or catastrophic like volcanoes • Too many individuals living together may result in disease, more predators and starvation
Population growth • Population growth=births-deaths+immigration-emigration • When births+immigration=deaths+emigration then population growth=0 • Growth is measured in units per time eg 30 live births per year • Or measured per capita rate eg 3 live births per 1000 individuals per year • Shown as curves
Population growth curves • Two important curves • Exponential • Occurs when a new population is established • Often low mortality so most individuals contribute to natality • No resource limits yet • Sigmoidal • Established population with similar mortality and natality after exponential curve of initial population establishment
The rate of loss is on a population basis • Survivorship may vary between populations eg infant losses in poverty and war affected Africa are significantly greater than in middle class NZ • Late loss populations tend to have fewer offspring
Life tables and survivorship • Populations have different life patterns • Early loss: produce millions of offspring, most of which die young, and a small number survive to breed fish • constant loss have some die young some middle age and some die old, so they can die anytime and the losses to the population are pretty constant rodents • late loss very few die young or middle aged but death rates are huge in the aged humans
Population Age Structure • The proportions of young and older individuals in a population give us information on the likely future of a population • The measurement can be in time where the ages are known or may be in height or width or growth rings where these are used to estimate age
Growing populations have a large number of young • Stable populations have about 2 young for each mature individual • Endangered species may have 1 young individual for every 2 mature individuals • Loss of an age group can lead to population collapse
r and K selection • Maximum rate of reproduction is r • Maximum carrying capacity of the environment is K • r-selectedspecies are often colonisers and have rapid growth in disturbed environments. They tend to live briefly and have lots of offspring. They don’t compete well so get replaced with K species
K-selected species exist at carrying capacity. They are excellent competitors and occupy a niche. They live long and put more effort into their offspring, and die old • Most organisms are somewhere inbetween these two extremes
The 3 factors that control distribution • Tolerance (to a lot of different things) • Absence or excess of an important environment factor • Geographical barrier
What is Tolerance • Ability to survive variation in environment conditions is called tolerance • Optimum range is where you have a normal life • Outside ‘optimum’ activity is limited • Too far outside optimum and you die • Tolerance effects temperature, water, salinity, humdity, anything abiotic…
Law of Tolerances • States: for each abiotic factor, an organism has a range of tolerances within which it can survive. Toward the upper and lower extremes of this tolerance range, that abiotic factor tends to limit the organism’s ability to survive
Acclimation • You can change tolerance if you change conditions slowly – called acclimation • We change every year with the seasons
Lieberg’s Law of the Minimum • The functions of an organism is limited or controlled by whatever essential environment factor is present in the least favourable amount • NOTE could be abiotic or biotic
In short… • Biotic • And abiotic factors • WOOT!! You already knew that!
Competition for a limited resource • If there is a shortage of one thing eg food, then that controls the population size • If space, then stressed behaviours such as eating infants or reduced birth-rates can control populations • Territories reduce the space stress • Reduce the number of breeding males • Hierarchies do the same
Self poisoning through waste • Especially in micro-organisms wastes kills the population • Poisons don’t only kill competitors • Fungi make penicillin which kills bacteria but slows fungi growth • Yeasts kill themselves with alcohol
Disease and parasitism • Crowded populations spread disease faster • Caused by bacteria, fungi, viruses and parasites (malaria) • Main controller of human populations before 1800s
Parasites don’t kill off their food – its not a good idea • May reduce the population by killing individuals, but never reach numbers to kill the host population
Gause’s principle • No two species with similar needs for the same limiting resources can co-exist in the same place • So if two paramecium speciesare put in the same container – one of them will die • If two birds hunt the same moth exclusively – one of them will die/emigrate/change
Predation • Think sheep and wolves • More sheep = more wolves • Too many wolves means not enough sheep and the wolves die. The sheep also become very hard to catch! • Wolves die and then the sheep numbers take off again!
Emigration • Populations can be reduced if some members leave • Eg lemmings (they never jump in the sea, by the way) • Bees (swarming) • Locusts • What the stimulus is to make some members leave is unknown
Humans as controllers of animal and plant populations • Humans kill off whole populations by • Over-hunting (whales, cod) • Destroying habitats (mangroves, forests) • Over use of pesticides (DDT) • Toxic wastes from manufacturing
Quadrats • Small defined areas • Could be permanent or temporary • Can be regular or random • Need to get the right size quadrat for the job
Line transects • Individuals along a line counted at regular intervals
Belt Transects • Individuals within a band are counted • Lay down a belt (like long skinny quadrat), and count everything within the belt • Useful in forests
Mark and recapture • Used for mobile animals like birds and fish • Animals marked in such a way as not to make them more vulnerable to predators, left for suitable time and then another sample taken • Total population=[(# in 1st sample) x (# in 2nd sample)] / # marked individuals recaptured
Methods of marking animals • Tatooing • racehorses • Radiation • experiments • Satellite tags • Particularly long travellers like whales • Paint • Bees and sheep