Download
1 / 4
80 likes | 563 Views
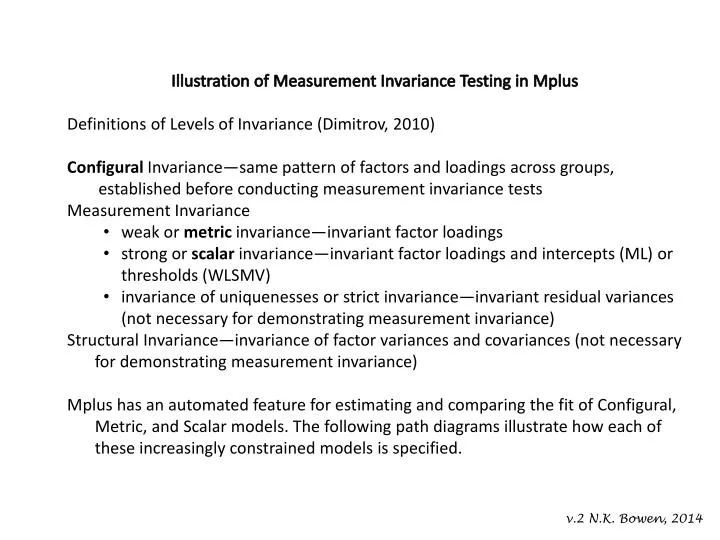
Illustration of Measurement Invariance Testing in Mplus Definitions of Levels of Invariance ( Dimitrov , 2010) Configural Invariance—same pattern of factors and loadings across groups, established before conducting measurement invariance tests Measurement Invariance

E N D
Illustration of Measurement Invariance Testing in Mplus • Definitions of Levels of Invariance (Dimitrov, 2010) • Configural Invariance—same pattern of factors and loadings across groups, established before conducting measurement invariance tests • Measurement Invariance • weak or metric invariance—invariant factor loadings • strong or scalar invariance—invariant factor loadings and intercepts (ML) or thresholds (WLSMV) • invariance of uniquenesses or strict invariance—invariant residual variances (not necessary for demonstrating measurement invariance) • Structural Invariance—invariance of factor variances and covariances (not necessary for demonstrating measurement invariance) • Mplus has an automated feature for estimating and comparing the fit of Configural, Metric, and Scalar models. The following path diagrams illustrate how each of these increasingly constrained models is specified. v.2 N.K. Bowen, 2014
Scale factors (if Delta) or Residual variances (if Theta) Scale factors (if Delta) or Residual variances (if Theta) d3 d2 d4 d1 1 d3 1 d2 d4 1 1 d1 1 1 x3 x2 1 1 x4 x1 x3 x2 x4 l2 t1 t2 t3 l3 t1 t2 t3 x1 l4 t1 t2 t3 1 t1 t2 t3 l2 t1 t2 t3 l3 t1 t2 t3 l4 t1 t2 t3 1 t1 t2 t3 Risk factor mean=0 Risk factor mean=0 GROUP 1 GROUP 2 (and subsequent groups) CONFIGURAL INVARIANCE AS TESTED WITH MPLUS INVARIANCE SHORTCUT (WLSMV) Loadings (except first) and thresholds free l = factor loading; t = threshold; Black lines indicate FIXED paths and variances Blue lines indicated paths and variances CONSTRAINED to be equal across groups Red lines indicated FREELY estimated paths or variances. Variance s of x and y variables are not estimated. N.K.Bowen, 2014
Scale factors (if Delta) or Residual variances (if Theta) Scale factors (if Delta) or Residual variances (if Theta) d3 d3 d2 d2 d4 d4 d1 d1 1 1 1 1 x3 x3 x2 x2 x4 x4 x1 x1 l2 t1 t2t3 l3 t1 t2 t3 l2 t1 t2 t3 l3 t1 t2 t3 l4 t1 t2 t3 1 t1 t2 t3 l4 t1 t2 t3 1 t1 t2 t3 Risk Risk factor mean=0 factor mean free GROUP 1 GROUP 2 (and subsequent groups) METRIC INVARIANCE AS TESTED WITH MPLUS INVARIANCE SHORTCUT (WLSMV) Loadings (except first) constrained; thresholds free except those constrained for identification l = factor loading; t = threshold; Black lines indicate FIXED paths and variances Blue lines indicated paths and variances CONSTRAINED to be equal across groups Red lines indicated FREELY estimated paths or variances. Variance s of x and y variables are not estimated. N.K.Bowen, 2014
Scale factors (if Delta) or Residual variances (if Theta) Scale factors (if Delta) or Residual variances (if Theta) d3 d3 d2 d2 d4 d4 d1 d1 1 1 1 1 x3 x3 x2 x2 x4 x4 x1 x1 l2 t1 t2 t3 l3 t1 t2 t3 l2 t1 t2 t3 l3 t1 t2 t3 l4 t1 t2 t3 1 t1 t2 t3 l4 t1 t2 t3 1 t1 t2 t3 Risk Risk factor mean=0 factor mean free GROUP 1 GROUP 2 (and subsequent groups) SCALAR INVARIANCE AS TESTED WITH MPLUS INVARIANCE SHORTCUT (WLSMV) Loadings (except first) and thresholds constrained across groups l = factor loading; t = threshold; Black lines indicate FIXED paths and variances Blue lines indicated paths and variances CONSTRAINED to be equal across groups Red lines indicated FREELY estimated paths or variances. Variance s of x and y variables are not estimated. N.K.Bowen, 2014