Download
1 / 23
230 likes | 453 Views
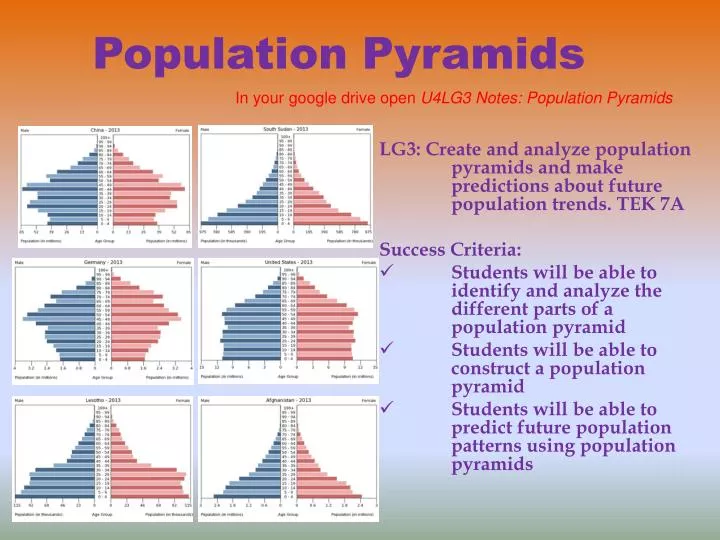
In your google drive open U4LG3 Notes: Population Pyramids. Population Pyramids. LG3: Create and analyze population pyramids and make predictions about future population trends. TEK 7A Success Criteria:

E N D
In your google drive open U4LG3 Notes: Population Pyramids Population Pyramids LG3: Create and analyze population pyramids and make predictions about future population trends. TEK 7A Success Criteria: Students will be able to identify and analyze the different parts of a population pyramid Students will be able to construct a population pyramid Students will be able to predict future population patterns using population pyramids
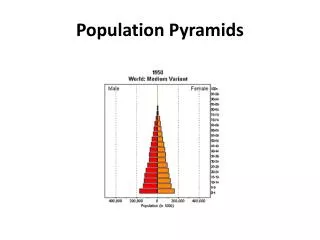
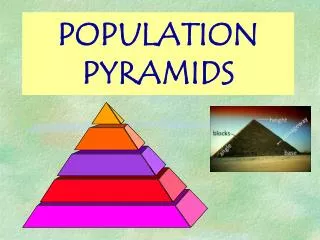
Population Pyramids Definition Purpose Analysis of population pyramids allows us to determine slow, rapid, or negative population growth rates. • A graph that shows the gender/age composition of a population at a specific time. • It consists of two horizontal bars that represent the male and female populations in a country at different age groups.
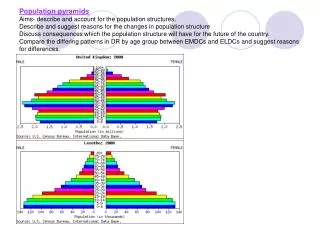
Instructions • Analyze the following population pyramids • Then answer the questions for each… • What type of growth is reflected in the graph? Rapid, Slow, or Negative • What level of development is reflected in the graph? More, Newly Industrialized, or Less
Why are the largest percentage of people between the ages 50-54?
What will happen to this country if the current population trend continues?
Why is such a large percentage of the population below the age of 40?
What social issue will be of growing concern in the coming years?
Demographic Transition Model • Stage 1: Pre-Industrial - High Birth/High Death - Less Developed - Primary Economic Activities • Stage 2: Industrializing - High Birth/Rapidly Decreasing Death - Newly Industrializing - Transition from Primary to Secondary Economic Activities • Stage 3: Industrialize - Rapidly Decreasing Birth/Low Death - Newly Industrializing - Mostly Secondary Economic Activities, Emergence of Tertiary Economic Activities • Stage 4: Post-Industrial - Low Birth/Low Death - More Developed- Mostly Tertiary Economic Activities, emergence of Quaternary Economic Activities
Population Density Map • A population density map is a map that shows the distribution of people in a certain geographical area. • Usually represented in people per square mile or square kilometer.
Cartogram • A map in which some thematic mapping variable is substituted for land area or distance. • Population • GDP • Electoral Votes